

Volume Ladder is one of the most important indicators of order flow analysis. It displays Volume, Bid/Ask, delta, acceleration, deceleration, absorption, imbalance and other volume statistics all together inside of each bar. Volume Ladder needs 1-Tick data to be built.
The purpose of volume analysis is to understand market movements in advance by highlighting possible support or resistance levels or, more generally, possible market pivot points.
Volume Ladder (a.k.a footprint®) is part of a set of indicators for volume analysis essential to understand market movements in advance. This set also includes Volume Profile, TPO-Profile, Market Depth Map (heatmap), Volume Bubbles, Volume Delta, VWAP, Volume-Meter, Volume on Bid/Ask, Session Statistics and others.
Most of these indicators show the volume traded across the various price levels, highlighting buyers and sellers.
Calculation Properties #
You can access calculation properties from Properties Tab of the indicator configuration window.
Calculation Method: specifies how the volume of every single tick is assigned to Bid or Ask:
- Tick Direction: volume is assigned to Bid or Ask based on direction of current tick compared to previous one. In other words, if current tick price is higher than previous one the volume is assigned to Ask, if lower it is assigned to Bid, if equal it is assigned to bid or ask based on the last assignment made.
- Bid/Ask: volume is assigned to Bid if seller is the aggressor, or to Ask if buyer is the aggressor. If the aggressor is unknown and price is between bid and ask, the volume is assigned to bid or to ask depending on last assignment made.
Calculate using: specifies whether to use Volume or Tick Count (number of trades) to calculate the indicator. Unless you have special needs, we recommend you use the Volume.
Time Range: specifies the number of trading sessions/days on which to calculate the indicator. 1-tick resolution data is used to calculate the indicator. For this reason we recommend you not to overdo the time range. Data loading and calculation times progressively increase with the time range. However, there is no recommended time range to use. It depends on many factors and in particular on your PC performance, your Internet line and your data feed. Set this property correctly according to your needs and the performance of your PC/data-feed. If you notice very long loading times, decrease the time range.
Ticks per Row: specifies the width (in ticks) of each single price level. A tick is the smallest price movement (tick-size) defined in the instrument configuration. Usually, the correct value for this property is 1. For some instruments, where the tick-size is very small compared to the current price (eg US stocks), it may be necessary to group a number of price levels into a single level by setting this property to a value greater than 1.
Value Area (%): specifies the Value Area width (as a percentage). Typical value of this property is 68.2 (default). We recommend you do not change it unless you have special needs.
Trade Size Filter: Filter every single trade (tick) based on its volume. ONLY trades that respect the set condition are considered in the calculation. For example, you can set a condition to consider only trades with volume greater than or equal to 10.
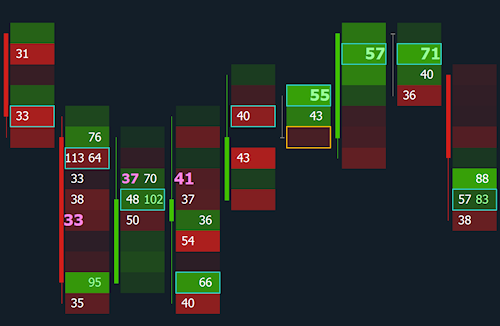
Ladder Qty Filter: This is a filter applied at the end of calculation to each single bid/ask level. ONLY bid/ask values that meet the condition are shown on screen. For example, only bid/ask values with volume greater than or equal to 30 are shown in the following image:
Imbalance – Level:
An Imbalance is an excessive difference between Bid volumes of a certain price level and Ask volumes of the immediately higher price level, or between Ask volumes of a certain price level and Bid volumes of the immediately lower price level (bid and ask volumes are compared diagonally).
You can configure up to 3 levels of Imbalance based on the difference (%) in volume between bid and ask, and highlight them in 3 different ways. You can thus graphically distinguish the importance of imbalance.
For each level of Imbalance you can define:
- Bid/Ask Ratio (%): minimum value (in percentage) of difference between bid and ask volumes
- Minimum Delta: minimum difference (in absolute value) between bid and ask volumes
In other words, an Imbalance on Bid is confirmed if:
- Bid volume of a certain price level is greater than x% (value defined in Bid/Ask Ratio (%)) of the Ask volume of the next higher price level
- and if the difference in absolute value between Bid and Ask volumes is greater than or equal to a certain minimum quantity (value defined in Minimum Delta).
Viceversa, an Imbalance on Ask is confirmed if:
- Ask volume of a certain price level is greater than x% (value defined in Bid/Ask Ratio (%)) of Bid volume of the immediately lower price level
- and if the difference in absolute value between Bid and Ask volumes is greater than or equal to a certain minimum quantity (value defined in Minimum Delta).
Support/Resistance Zones
A number of concecutive Imbalances of the same type identify a support or resistance zone. More precisely, x stacked Bid type Imbalances identify a Resistance area, while x stacked Ask type Imbalances identify a Support area. Set the following properties according to your needs:
- S/R Zone – Stacked Imbalances: defines how many stacked Imbalances are needed in order to identify a support/resistance zone
- S/R Zone – Ticks beyond zone: defines by how many ticks the current prices must go beyond the support/resistance zone to consider the zone as broken. In other words, if tick (instrument minimum-price-movement) is equal to 0.25 and this property value is 2, current prices must go beyond support/resistance zone by 0.5 to consider the zone definitively broken and therefore no longer valid.
Top / Bottom Imbalance
An Imbalance is an excessive difference between Bid volumes of a certain price level and Ask volumes of the immediately higher price level, or between Ask volumes of a certain price level and Bid volumes of the immediately lower price level (bid and ask volumes are compared diagonally).
Top / Bottom imbalances are special imbalances that appear at the top or bottom of the ladder and help identify market turning points. More precisely, a Top imbalance indicates a probable downward turn in the market or a continuation of the downtrend, a Bottom imbalance indicates a possible upward turn in the market or a continuation of the upward trend.
You have 3 calculation properties available:
- Bid/Ask Ratio (%): minimum value (in percentage) of the difference between bid and ask volumes of the first and second level
- Minimum Delta: minimum difference (in absolute value) between bid and ask volumes of the first and second level
- Confirmation Delta: minimum difference between bid and ask volumes of the second and third level
A Top imbalance is identified when:
- Bid of level immediately below the highest level (Top) is x% greater than Ask of the highest level (Top) (value defined in Bid/Ask Ratio (%)
- and the difference (in absolute value) between Bid and Ask volumes is greater than or equal to a minimum amount (value defined in Minimum Delta)
- and Bid of level 3 (starting from Top) is greater by x quantities than Ask of level 2 (value defined in Confirmation Delta).
A Bottom imbalance is identified when:
- Ask of level immediately below the lowest level (Bottom) is x% greater than Bid of the lowest level (Bottom) (value defined in Bid/Ask Ratio (%)
- and the difference (in absolute value) between Bid and Ask volumes is greater than or equal to a minimum amount (value defined in Minimum Delta)
- and Ask of level 3 (starting from Bottom) is greater by x quantities than Bid of level 2 (value defined in Confirmation Delta).
Remember to enable Top / Bottom Imbalance drawing in ‘Style’ Tab.
Style Properties #
You can access style properties from Style Tab of the indicator configuration window.
WARNING: In addition to the properties listed here, there are many other properties that are minor or do not need further explanation.
Volume Ladder style is highly configurable. By using style properties you can set background, candle, volume profile, VPOC, value area, imbalances, support/resistance zones, absorptions, etc. at your convenience.
Feel free to “play” with style properties (nothing breaks!) to find the configuration that best suits your needs
Ladder #
Value Type: specifies the value to show on ladder:
- Bid/Ask: (classic view) Bid volumes on the left and Ask volumes on the right
- Delta: displays delta (Ask – Bid) in the center of ladder
- Volume: displays volume (Ask + Bid) in the center of ladder
Background: specifies whether to display and how to color the background of each price level:
- Hide: no background
- Delta: background is colored based on delta (Ask – Bid)
- Bid/Ask Volume: background is colored based on Bid/Ask volumes
- Total Volume: background is colored according to Bid/Ask volumes and level total volume. More precisely, level background is divided into two sections (Bid and Ask). Each section width depends on level Bid/Ask values, while the two sections color intensity depends on respective bid/ask values compared with bar maximum bid/ask values.
- Custom: allows you to color the ladder background as you wish based on values present. You have up to 6 levels/conditions that you can assign a color to. For example, you can color the cell background in yellow where the value contained is greater than or equal to 50, in blue where the value is greater than 100 and so on. Cells that do not meet any conditions are colored with default bid/ask/volume colors.
For all backgrounds, the greater the value, the greater the opacity of background color.
You can also combine Value Type and Background to display different information (except for the Custom background). For example, you can view Bid/Ask values (Value Type = Bid/Ask) and a background based on Delta or Total Volume of the level so that you have more information at the same time. You have many other possible combinations available. Set the two properties according to your needs.
Candle #
Use properties in this section to draw or not the classic candle and set it according to your needs. You can set position, color, border etc.
Position: specifies candle position in reference to the Ladder: Left, Right, Center or Justify (draws candle in background using all space available for the Ladder).
Fill based on: specifies whether or not to fill the candle. You can choose from the following options:
- No Fill: If selected, only candle border will be drawn based on bar direction (comparison between Open and Close).
- Bar Direction: If selected, candle is filled according to the bar direction (comparison between Open and Close).
- Delta: If selected, candle fill color will be the DELTA color, shaded based on the comparison between DELTA and the session maximum DELTA value. Candle border will continue to represent the bar direction.
- Delta / Total Volume: If selected, candle fill color will be the DELTA color, shaded according to the bar DELTA / TOTAL VOLUME ratio. Candle border will continue to represent the bar direction.
Volume Profile #
Use properties in this section to draw or not the Volume Profile and set it according to your needs.
Volume Profile included in this indicator is not the full volume profile. If you need a full volume profile, please use one of Volume Profile indicators available in the indicator list.
Type: specifies whether to draw Volume Profile, Delta Profile or Volume Profile + Delta Colors (where each volume bar gets the bid or ask color depending on delta).
Position: specifies volume profile position with respect to the ladder: Left, Right or Justify (draws volume profile in background using all space available for the Ladder).
Direction: specifies volume-bars direction: from Right to Left or Left to Right.
Value Area #
Use properties in this section to draw or not the Value Area and set it according to your needs. The value area is identified by a vertical line (if drawn to the Left, Right or Center of Ladder), or by a particular background color (if drawn in the ‘Justify‘ position).
VPOC (Volume Point of Control) #
VPOC is the price level with the greatest volume, around which the value area is calculated. Use properties available in this section to draw or not the VPOC and set it according to your needs.
You can choose whether to highlight VPOC level on the ladder and/or on Volume-Profile / Delta-Profile (if visible). More precisely:
- on the Ladder, you can choose whether to display the VPOC of total volume (bid + ask), or 2 separate VPOCs for Bid and Ask (i.e. one VPOC for Bid volumes and one for Asks), or Delta POC
- on Volume-Profile (if visible), VPOC of total volume (bid + ask) is highlighted
- on Delta-Profile (if visible), maximum delta (in absolute value) is highlighted.
Naked Line: is a horizontal line drawn from VPOC (bid+ask total volume) and extended to the end of chart (right side). The line is drawn ONLY if the price level has not yet been reached by current prices.
Unfinished Auction #
Unfinished Auction highlights with a color the maximum/minimum price level of bar if in this level there are volumes on both Bid and Ask. Prices will tend to return to that level in subsequent bars.
Naked Line: is a horizontal line drawn from Unfinished Auction and extended to the end of chart (right side). The line is drawn ONLY if the price level has not yet been reached by current prices.
Imbalance – Level 1, 2, 3 #
This section contains all style properties to highlight or not the 3 Imbalance levels on chart.
You can define the Highlighter Type:
- Rectangle: the corresponding Bid or Ask is highlighted with a rectangle of a certain color
- Background: the corresponding Bid or Ask is highlighted by coloring the background with a certain color
- Pin: the corresponding Bid or Ask is highlighted with a pin of a certain size and color
- Font: the corresponding Bid or Ask is drawn with a font of a certain size and color
Support/Resistance Zones #
This section contains all style properties to draw or not on chart the support/resistance zones identified by x stacked Imbalances.
You can define the color and opacity of zones, decide whether to extend them to the right up to Y-axis or only for a certain number of pixels, and whether or not to hide them once they are reached by current prices.
Top / Bottom Imbalance #
This section contains all style properties for drawing or not Top / Bottom Imbalances on chart. In particular, a Top Imbalance is drawn as a downward arrow at the ladder top, while a Bottom Imbalance is drawn as an upward arrow at the ladder bottom.
Session Ladder #
Session Ladder is a summary ladder of the entire session displayed on the right side of chart. You can decide whether to draw it or not, also defining a style that is partially different from the rest of indicator.
In particular, you can define the Value Type, Background and Width of ladder. You can also decide whether or not to display the Candle, Volume Profile, Value Area, VPOC and Imbalances.
Bar Totals #
You can display some values (bar totals) near the top or bottom of the ladder:
- Volume: total volume
- Delta: Ask – Bid
- Delta Change: difference between the current bar delta and the previous bar delta
- High/Low Ratio: helps identify market turning points following the exhaustion of buyers/sellers.
The ratio is calculated using Michael Valtos’s method:
– In a positive bar (open lower than close): (Bid quantity of the level above the bar low) / (Bid quantity of the bar low level). Ratio is displayed at the Ladder bottom.
– In a negative bar (open higher than close): (Ask quantity of the level below the bar high) / (Ask quantity of the bar high level). Ratio is displayed at the Ladder top.
– In a neutral bar (open equal to close) the ratio is NOT calculated.
The ratio becomes significant when it exceeds certain levels (definable in Highlight if higher or equal to + Highlight if lower or equal to properties). A value above or below these levels indicates a potential market turn. Specifically:
– The upper level (also known as Ratio Bounds High) has a default value of 28. Ratio values greater than or equal to 28 indicate that buyers (in a negative bar) or sellers (in a positive bar) lack the strength to continue.
– The lower level (also known as Ratio Bounds Low) has a default value of 0.699. Ratio values less than or equal to 0.699 indicate the presence of sellers at the highest ladder level (in a negative bar) or buyers at the lowest level (in a positive bar).
For more information on the ratio, search online for Michael Valtos’s High/Low Ratio.
Bar Statistics #
You can display statistical values for each bar at the bottom of chart window. Each single value takes on a different color and background shade depending on the value itself:
- Trades: trade count
- Volume: total volume
- Ask: Ask total volume
- Bid: Bid total volume
- Delta (Bar): Ask – Bid
- Delta % (Bar): (Ask – Bid) / Volume
- CUM Delta: cumulative delta
- Min Delta: delta minimum value (bar)
- Max Delta: delta maximum value (bar)
FREQUENTLY ASKED QUESTIONS #
Numbers are not displayed #
Numbers are displayed if there is enough vertical and horizontal space to draw them. If price levels are too small (height and width), numbers are not shown. You have 2 possible solutions:
- Zoom-in on the X Y-axes until numbers appear
- or set Ticks per Row property to a value greater than 1 (such as 10). Try to see which value is best for you and the instrument. This way you will group multiple price levels into one and the vertical space available for numbers will be greater. For very high priced instruments such as Bitcoin, we recommend you set the property to a very high value (e.g. 1000).


