

Strategy Tester is the application that allows you to run backtests of trading systems developed with the Overbasic programming language.
A backtest consists of applying the trading system to one or more instruments (data series) and obtaining a detailed report on the results produced: list of signals generated, capital performance, profits/losses, commissions, consecutive winning/losing trades, drawdown, run-up, etc. This report can be exported to a text file (.txt, .csv) that can be used with Excel or other spreadsheets.
To run a backtest you need to:
- Access Strategy Tester
- Create a Strategy
- Run the Backtesting
- Read the Report
Access Strategy Tester #
You can access Strategy Tester in one of the following ways:
- from Overcharts main window > Tools menu > Strategy Tester
- from the workspace window > Tools menu > Strategy Tester
Create a Strategy #
To backtest one (or more) trading systems you need to create a strategy. A strategy relates one (or more) trading systems with the instruments (data series) where to perform the test, defining all the test parameters and in particular: data range and resolution, simulation account, trade costs, slippage, etc.
To create a strategy:
- Strategy-Tester main window > File menu > New Strategy
- or Strategy-Tester main window > press New Strategy button in the toolbar at the top
- or Strategy-Tester main window > Tab Home > press New button in the toolbar on the left
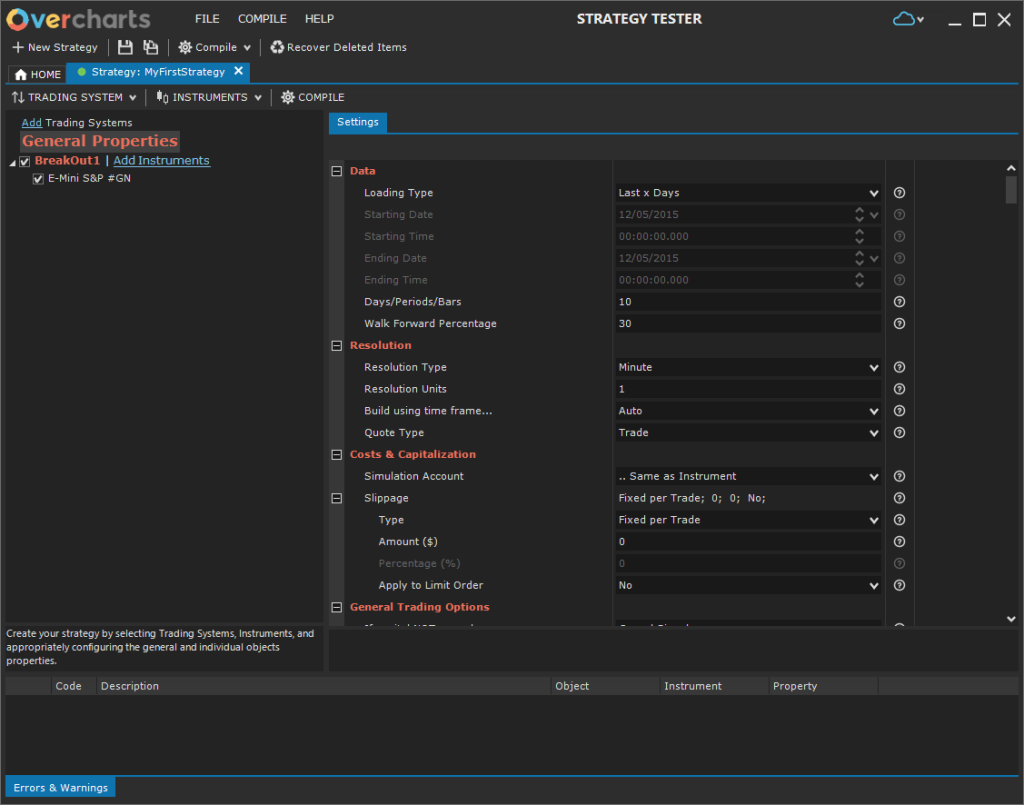
After defining the strategy name, the configuration window will automatically open:
Add trading systems to test #
You can add one (or more) trading systems to the strategy, in one of the following ways:
- from strategy settings window > press Add Trading System link
- or from strategy settings window > Trading System button> Add Trading Systems
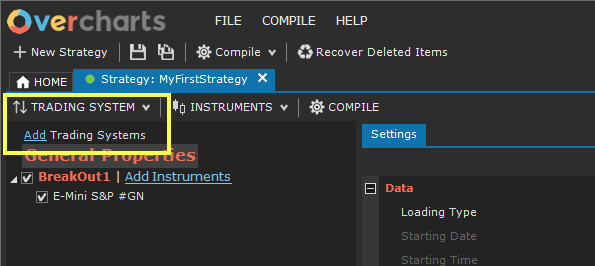
You can add multiple trading systems to a single strategy. In this case, the report will contain the test results of all trading systems.
Tests are ALWAYS independent of each other. In other words, if a strategy contains 2 trading systems, the testing of trading-system-1 will NOT affect the testing of trading-system-2 in any way.
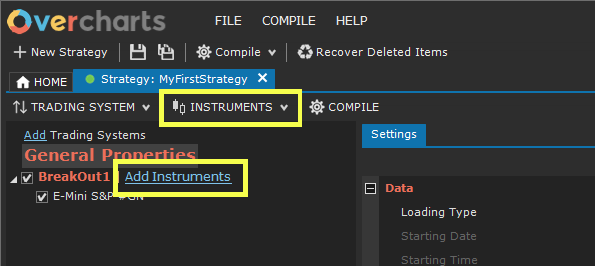
Add instruments to trading systems #
Add, for each trading system, the instruments (data series) where to perform the test.
You can add one (or more) instruments to a trading system, in one of the following ways:
- press Add Instruments link next to the trading system
- or select the trading system > Instruments button > Add Instruments
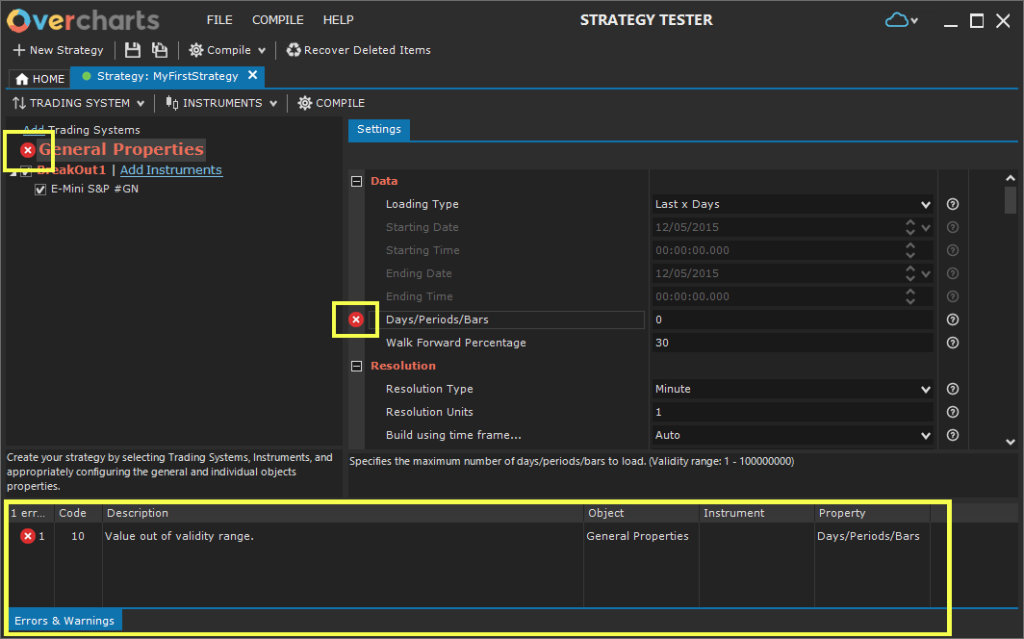
Define Properties #
Define general and specific properties for each trading system / instrument.
INCORRECT properties are marked with a special red icon and the error is described in detail in the section below:
General Properties
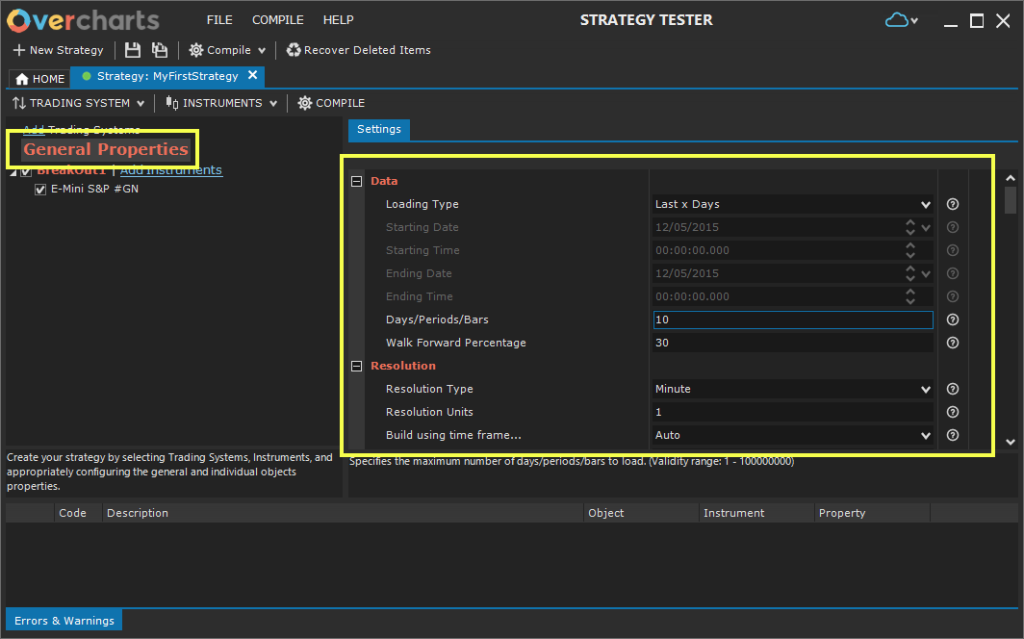
Data #
Loading Type: specifies how to load historical data:
- Last x Days: load the last x days.
- Last x Months: load the last x months. Eg If x=1 and today is June 15th, data will be loaded starting from May 16th.
- Last x Years: load the last x yeas. Eg If x=1 and today is June 15th, data starting from June 16th of previous year will be loaded.
- Date Range: loads the specified date range.
- Days previous the specified date: (not recommended) loads x days prior to a specified date. To be used only if really necessary.
- Days from the specified date: (not recommended) loads x days starting from a specified date. To be used only if really necessary.
- Last x Bars: (not recommended) load the last x bars..
- Bars previous the specified date/time: (not recommended) loads x bars prior to a specified date/time. To be used only if really necessary.
- Bars from the specified date/time: (not recommended) loads x bars starting from a specified date/time. To be used only if really necessary.
Walk Forward Percentage: defines (in percentage) the portion of data series to be used in the Walk Forward test. The main purpose of a Walk Forward test is to determine whether the good performance of an optimized trading system is the illusory result of overfitting, or is the result of a robust trading model capable of predicting market price dynamics and therefore to be profitable on unknown market data following optimization.
By appropriately defining the Walk Forward Percentage property in the strategy configuration, you can divide data series used in the test into two parts. 2 tests will therefore be performed, one on the first part of data series and the other (Walk Forward) on the remaining part, obtaining two separate reports. You will be able to compare the results obtained in the two parts of data series, effectively simulating an initial optimization of the trading system and its subsequent application in the “real” market.
Resolution #
Resolution is usually the time interval represented by each bar in the chart. We say ‘usually‘ because actually Tick, Contract, Point resolutions do not represent a specific time interval, but an amount of ticks, contracts (volume), points (range). In these particular types of resolution each bar contains a specific number of ticks, contracts, points and can last an indefinite time (bar is closed only when it reaches the specified amount).
Resolution Type + Resolution Units: specify the chart resolution. For example, if Resolution-Type is Minute and the Resolution-Units is 5, each bar in the chart represents 5 minutes.
Available Resolutions:
- Tick: resolution-units represents the number of ticks (trades) contained in each single bar. The bar closes when the specified amount of ticks is reached.
- Contract (Volume Bar): resolution-units represents the amount of volume contained in each single bar. The bar closes when the specified amount of volume is reached. Volume can be expressed in number of contracts/shares or in cash depending on the data-feed.
- Point (Range Bar): resolution-units represents the price range (in points) of each single bar (1 Point = Tick-size = Minimum-Price-Movement of the instrument). The bar closes when the specified price range is reached.
- Second: each bar represents x seconds
- Minute: each bar represents x minutes
- Hour: each bar represents x hours
- Session: each bar represents x trading sessions
- Day: each bar represents x days
- Week: each bar represents x weeks
- Month: each bar represents x months
- Quarter: each bar represents x quarters
- Year: each bar represents x years
Build using time frame…: (to be used ONLY in special cases) represents the time frame of the data to be used to build the chart. Default value is Auto and we recommend NOT to change it unless there are special needs. For example, you can change it if you want to create a ‘Daily‘ or ‘Weekly‘ chart using 1-Minute data instead of 1-Day data. You should know that in 1-day data provided by data-feeds, usually the day Open and Close values DO NOT correspond to the first and last price traded during trading session, but are obtained from auctions and/or averages of last x trades (settlement). For this reason, a daily or weekly bar built using 1-day data may be different from the same bar built using 1-minute data (including bar total volume).
Quote Type: data type to be used to build the chart (Trade, Bid, Ask). Unless you have special needs, in 99% of cases you will always and only use Trade.
Costs & Capitalization #
Simulation Account: specifies which simulation account to use in the test.
Slippage: Slippage is a quick way to quantify any additional cost caused by various events that may occur during the execution of a ‘Market’ order (it has no effect on limit orders, unless otherwise specified). It can be defined at the trade level (buy or sell order), or at the share/contract level. If the specified value is less than the instrument minimum price movement (tick-size), the actual slippage may be greater than that defined in this property.
Slippage types available:
- Fixed per Trade: specified slippage is applied to each Trade.
- Fixed per Share/Contract: specified slippage is applied to each Share/Contract.
- Percentage: using the percentage calculation method, slippage is determined dynamically as a percentage of the range between the optimal price and the worst execution price. The optimal price represents the ‘market’ price at the moment the signal is generated. The worst price corresponds to the maximum price of the bar (in the case of a buy signal) or the minimum price of the bar (in the case of a sell signal).
General Trading Options #
If capital NOT enough..: If the available capital is not enough to execute the entire trade quantity, you can cancel the signal or recalculate the quantity based on available capital. If after recalculation the quantity is equal to zero, the signal will be canceled. In the case of stop and reverse signals, the signal is not canceled completely, but only the part necessary to exit current position is executed.
Fill price of a limit order: defines how filling price of a limit order is determined. This property takes effect ONLY during backtesting. Possible values:
- Gone beyond of x tick: the order is considered filled only when current price exceeds the limit price of the order by x ticks (1 tick represents the minimum price movement specified in the instrument configuration).
- Just Touched: the order is considered filled when current price reaches the order limit price.
Trade Size (if not specified by trading system): Specifies how to calculate the trade quantity (single buy or sell trade), in case the quantity has not been defined by trading system. Possible values:
- Fixed Size: defined fixed quantity is used.
- Use all available equity: quantity is determined based on equity available at the time the signal is generated.
- Use this equity: quantity is determined based on the defined equity.
- Use a percentage of available equity: quantity is determined based on a percentage of the equity available at the time the signal is generated.
BackTesting – Trading Options #
Intrabar Order Generation: If enabled, trading system will be able to execute multiple trades in the same bar.
Bar Magnifier: (enabled ONLY if intrabar order generation is enabled) Defines data resolution to use during the test if intrabar order generation is enabled. Bar-Magnifier resolution MUST be less than and compatible with resolution specified in Resolution section. For example, if the main resolution is 1-Day, Bar-Magnifier resolution must be 1-Hour, 1-Minute or any other compatible resolution lower than 1-Day. In this way, 1-Day bar will be divided into many small bars allowing the generation of multiple orders during the day.
Trading system Options & Properties #
By selecting the trading system in the left treeview, you can define the value of trading system’s public Properties and Options (defined in the source code).
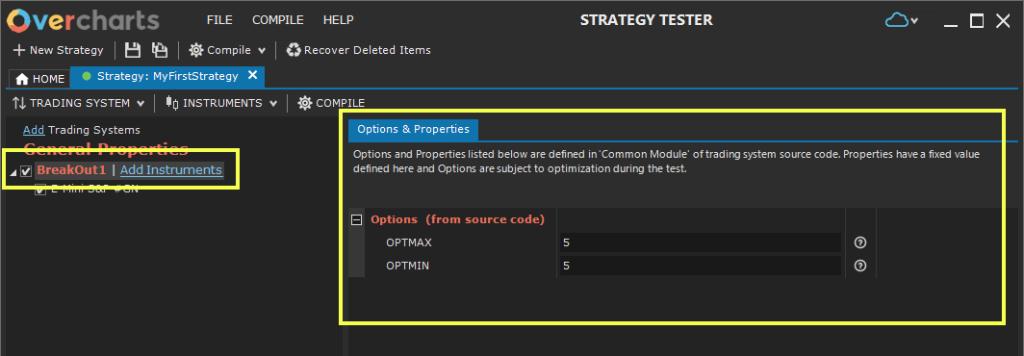
While the value of the Properties is fixed for the entire test, the value of the Options changes.
An Option is a numeric property with a well-defined validity range. The Backtest will automatically test all Option values (from minimum to maximum value, adding the increment value to each new test), with the aim of producing a full trading-system test for each combination of Options. In the report you will be able to compare the result produced by the different Option combinations and identify values that produce the best results.
Customize Instrument properties #
For each instrument you can customize the defined General Properties and the trading system Options & Properties.
To customize General Properties:
- Select the instrument in the left treeview.
- Select Settings Tab on the right.
- Select Customize Properties checkbox (above the property grid).
- Modify the properties according to your needs.
To customize Trading system Options & Properties:
- Select the instrument in the left treeview.
- Select Trading system Options & Properties Tab on the right.
- To customize Options, select Customized on Options (from source code) property.
- To customize Properties, select Customized on Properties (from source code) property.
- Modify the Options / Properties according to your needs.
Save the Strategy #
To save the strategy:
- press Save button in the toolbar at the top
- or from FILE menu > select Save the Strategy
Edit a Strategy #
You can modify an existing strategy at any time.
Access the strategy in one of the following ways:
- in the HOME Tab > treeview on the left > double click on strategy
- or in the HOME Tab > treeview on the left > right click on strategy > Edit
- or in the HOME Tab > treeview on the left > select the strategy > press Edit button in the toolbar above the treeview
Then modify the strategy according to your needs and press Save.
Start a backtest #
To start backtesting a strategy:
- in the HOME Tab > treeview on the left > right click on strategy > New ‘Individual’ test
- or in the HOME Tab > select the strategy in the left treeview > press NEW TEST button in the toolbar above report section > New ‘Individual’ Test
The new test launch window will open.
Step 1: Configuration check #
The backtest procedure will check the strategy configuration at startup. If there are errors in the configuration, it will not be possible to continue with test. You will have to correct all errors by appropriately modifying the strategy.
If the check passes, press NEXT to continue with Step 2.
Step 2: Definition of launch parameters #
Define the following launch parameters:
Test Name: test/report name.
Cash or Points: Specifies the test type. In a ‘Cash‘ type test the available capital and required margin influence the determination of the quantity of trades. In a ‘Points‘ type test available capital is NOT considered. The gain/loss is expressed in absolute points (not in currency). For example, if the instrument is bought at 100 and sold at 120, the absolute profit points will be 20 for each individual quantity.
Number of combinations to be stored: defines the maximum number of results to store. A result is a complete test performed using a given Option combination.
Sorting criteria: testing procedure will perform as many tests as there are Option combinations. The number of combinations can be many. Sorting criteria tell the test procedure how to select the best x combinations. You can define up to 10 sorting criteria.
Press NEXT to continue with Step 3.
Step 3: Start the Test #
Test starts. Close the launch window by pressing FINISH button.
You can check the test progress, pause it or stop it from Strategy Tester > HOME Tab:
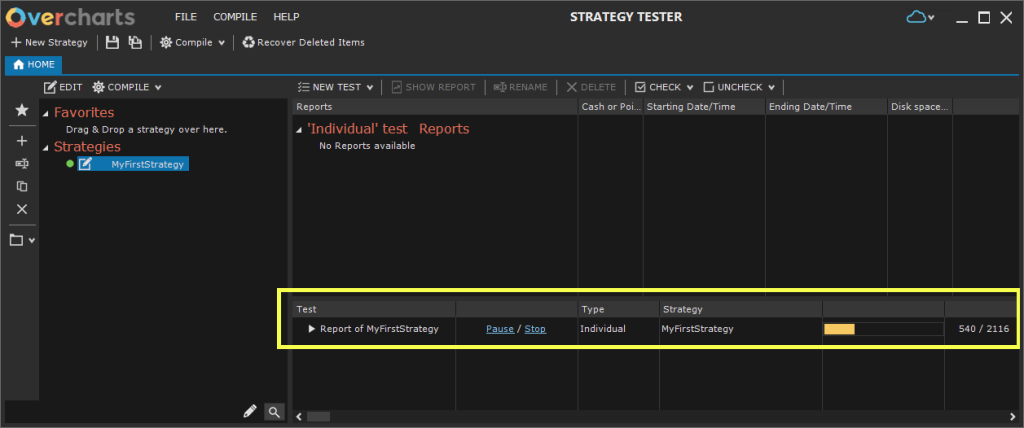
Wait for the test to complete, then access the report from report list:
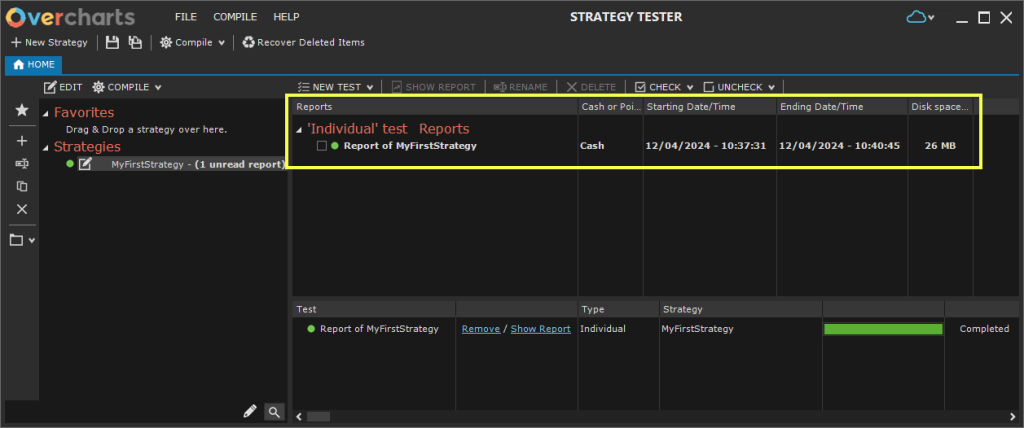
Reports are local ONLY. They are NOT synchronized between your different Overcharts installations.


