

Configuration window contains all properties of chart window and all properties of all objects it contains (charts, indicators, advanced columns, drawing tools, trading systems, etc.).
Through this window you can modify any calculation or style properties according to your needs
How to access #
Configuration window is one of the most used windows in Overcharts. For this reason, you can access it in several ways:
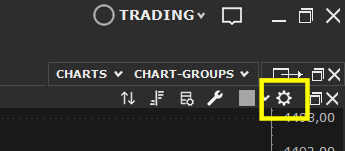
1. By pressing gear button at the top right of chart window:
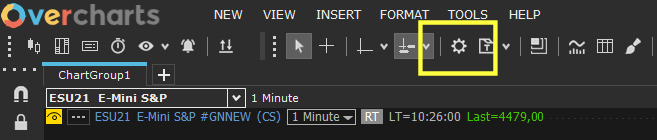
2. By pressing gear button on Charts toolbar:
3. From Format menu > Chart Window Settings
4. By double-clicking on the window or on a specific contained object
5. Right click on the window/object/section > Properties
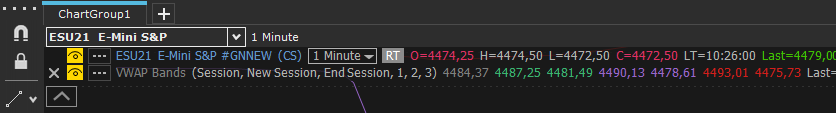
6. By clicking on object’s Status-Line:
Tree-view Sections #
Configuration is divided into different sections corresponding to the various types of object. This division makes searching and accessing properties very easy and fast.
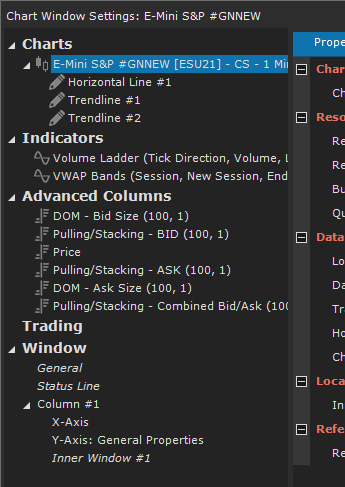
Available sections are:
- Charts: section containing all charts of the window
- Indicators: section containing all indicators of the window
- Advanced Columns: section containing all advanced columns of the window
- Trading: section containing all chart trading properties
- Window: Section containing all general, status-line, X-Y axes and inner-windows properties
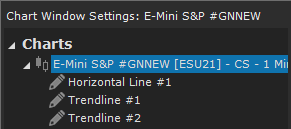
Objects such as drawing tools and trading systems are directly linked to the chart/indicator they belong to:
Properties #
The properties of an object are shown in the left grid which in turn is divided into different Tabs:
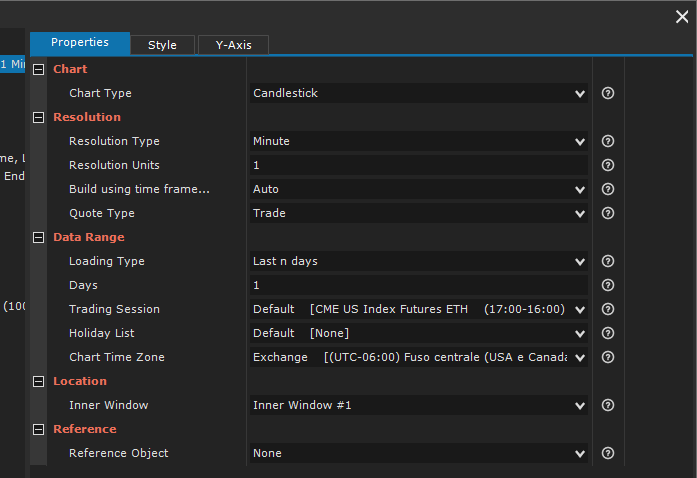
Calculation or general properties are located on Properties Tab, style and formatting properties on Style Tab.
Charts and indicators have a third Tab (Y-Axis) containing Y-axis (price/value scale) properties.
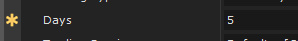
By modifying the value of a property, property will be marked as Changed and an asterisk will be displayed to its left:
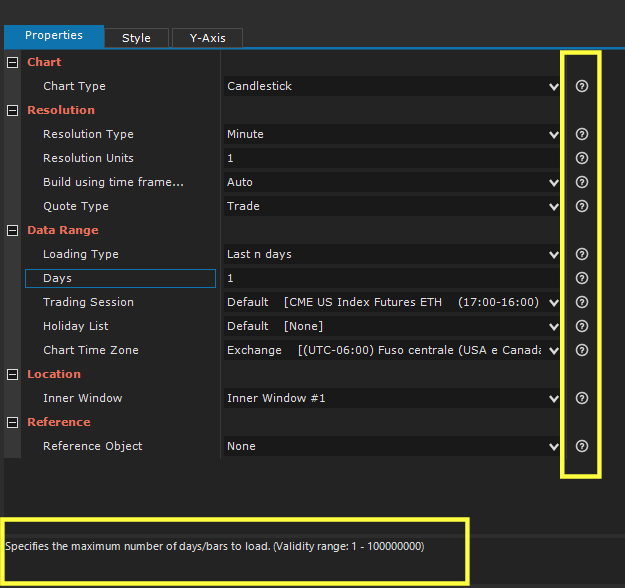
If a detailed description is available for the property, a help icon will be displayed to its right. Hovering over the icon, a tooltip containing the property description will be shown. The same description can be viewed in the box below, by selecting the property:
Configuration Errors #
If a property value is incorrect (for example it is out of the range of allowed values), property will be marked as incorrect and a detailed error description will be shown in the list below property grid:
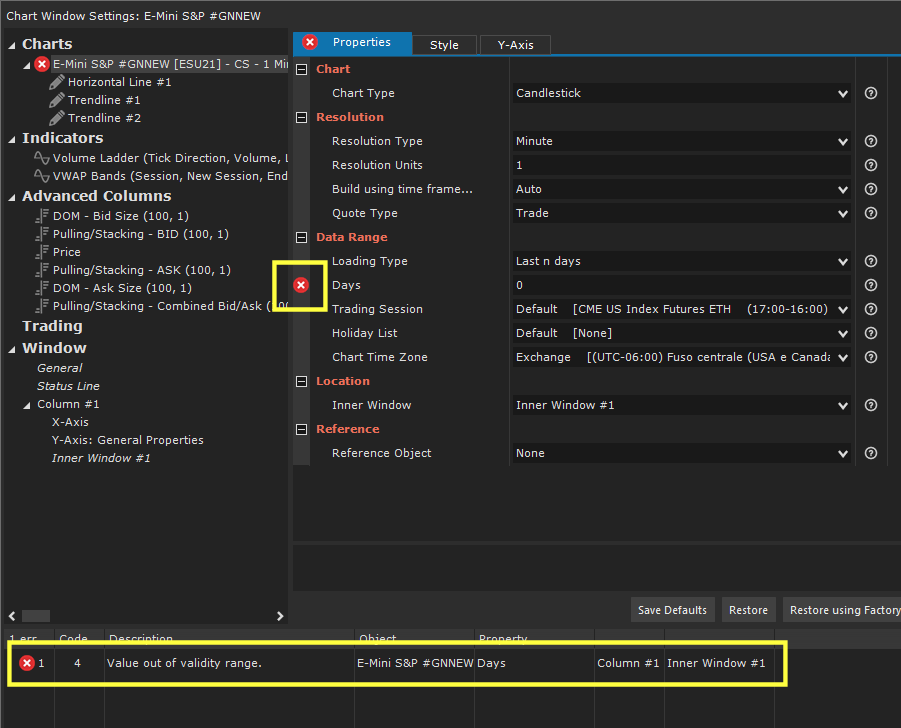
By double clicking on error description, corresponding property will be selected in the grid.
Default Values #
You can change a property default as you like from its factory value. After changing, when you add a new object of the same type to the chart, property will initially be set using new default.
For some properties you CANNOT change the factory value. Often these are properties whose value changes for each new object
To change a property default, please follow these steps:
1. Select the object from tree-view on the right
2. Change property value as you need
3. Save new default by pressing Save Defaults button:
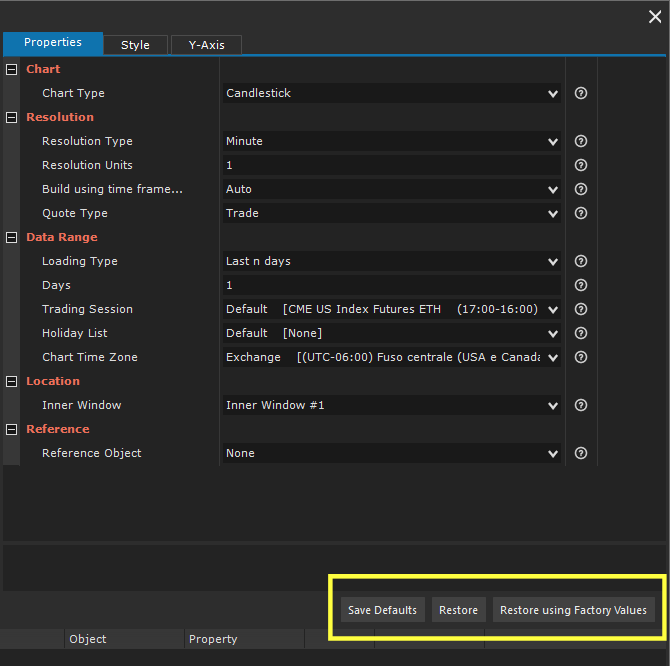
If after changing an object property values, you want to restore defaults:
1. Select the object from tree-view on the right
2. Press:
- Restore button to restore current defaults (current defaults may be different from factory defaults!)
- or Restore using Factory Values button to restore factory defaults
Restore or Restore using Factory Values buttons restore defaults to all object properties and not just to a particular property!
To restore all current defaults to factory defaults:
1. Select the object from tree-view on the right
2. Press Restore using Factory Values button
3. Press Save Defaults button
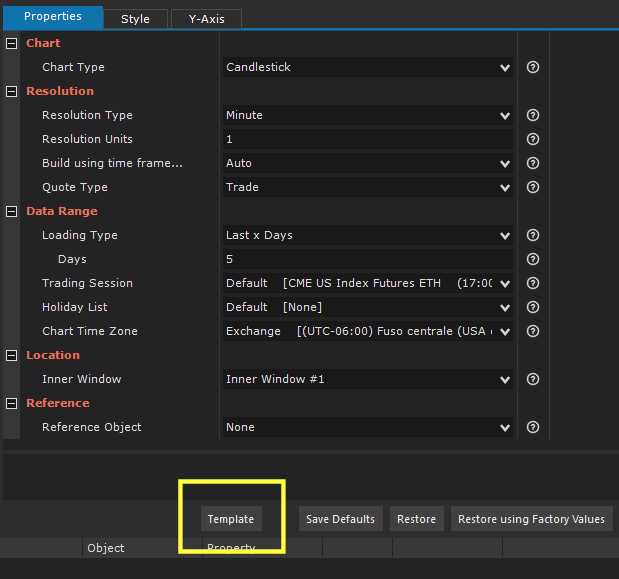
Object Template #
For each object such as a Chart, Indicator, Drawing tool, Advanced Column, Trading System etc., you can quickly set all style and calculation properties using a previously saved template. It is possible to save infinite templates for each single object.
Click HERE for complete documentation on Object Template.
Delete an Object #
From configuration window you can delete chart objects. There are actually better methods for deleting an object. This is another method you can use if the need arises.
To delete an object:
1. Select the object from tree-view on the right
2. Press Delete Object button:
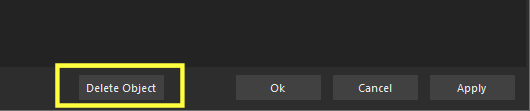
If Delete-Object button is disabled, you cannot delete selected object using this window.
General Window Properties #
In the Window section of tree-view you can find the chart window general properties:
- Background, text, line, etc. colors used in the window
- Status Line settings
- General properties of X and Y axes
- Other general properties common to the entire window
General #
Properties Tab:
- Tab Name: Specifies the text to display in the Chart Tab (refer to this documentation).
Style Tab:
- Colors: Select Customize Colors to change background, text, line, splitter, etc. colors according to your needs.
- Splitter: Defines splitter style (inner-windows resizing line).
- Background:
- Main Symbol: Displays and formats the main symbol on window background.
- X-Axis:
- Bar Countdown: Displays and formats the time / tick / volume (depending on chart resolution) remaining to the end of current bar.
- Drawings:
- Show Drawings: Uncheck this property to hide all drawing tools in the window.
Status Line #
This section contains all Status-Line formatting properties (refer to this documentation).
Column #
Style Tab:
- Colors: Select Customize Colors to change background, text, line, splitter, etc. colors of the specific column according to your needs.
- Zoom Scrollbar: Specifies whether or not to permanently display the chart scroll bar (refer to this documentation).
X-Axis #
This section contains all the formatting and styling properties of a column’s X-axis (refer to this documentation).
Properties Tab:
- Right Margin: Right margin in a chart represents a time interval (expressed in number of bars) added to the right of chart after last bar (refer to this documentation).
- Further Right Margin: In addition to the Right Margin, you can define an additional margin to the right of chart. This margin, unlike Right Margin, is NOT represented by any time interval. Further-Right-Margin management is completely automatic and transparent to the user (if DYNAMIC type). If, on the other hand, it is of the FIXED type, further-right-margin is equal to a fixed number of bars defined in the relative property. We RECOMMEND you always use the DYNAMIC type (default), unless you have particular needs (refer to this documentation for further information).
- Space between bars: Bars in a chart are spaced from each other by a Standard space. You can change the space between bars according to your needs by multiplying the standard space by x times.
Style Tab:
- Drawings:
- Show Grid Lines: Defines whether or not to display grid vertical lines and their style.
- Colors: Select Customize Colors to change background, text, line colors according to your needs.
- Fonts: Defines X-axis font.
Y-Axis: General Properties #
This section contains all the formatting and styling properties of a column’s Y-axis (refer to this documentation).
Properties Tab:
- Lock Y-Axis: refer to this documentation for further information.
- Right/Left Scale:
- Display: specifies whether or not to display the Y-axis.
- Width Calculation: specifies whether to calculate the scale width automatically or manually. In the case of manual calculation you will need to manually set the width (expressed in number of characters).
- Show Last Value Markers: if checked, latest prices/values of charts and indicators will be shown on Y-axis (unless otherwise specified in the chart/indicator configuration).
Style Tab:
- Drawings:
- Show Grid Lines: Defines whether or not to display grid horizontal lines and their style.
- Colors: Select Customize Colors to change text and line colors according to your needs.
- Fonts: Defines Y-axis font.
Inner Window #
This section contains all the formatting and style properties of a single inner window.
Style Tab:
- Colors: Select Customize Colors to change background, text, line, splitter, etc. colors of the specific inner window according to your needs.


