

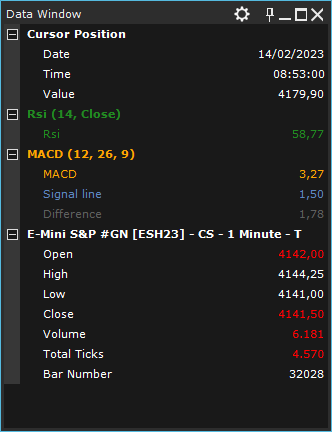
Data window displays values of charts and indicators present in a chart window corresponding to the mouse current position. Values are shown per object in a grid (name + value).
You can display data window, in one of the following ways:
- Workspace window > View menu > Data Window
- or press Data Window button on Charts toolbar.
You can choose which values to display by pressing gear button at the top right of window title-bar.
Available values:
- Date: date corresponding to the mouse current position on chart.
- Time: time corresponding to the mouse current position on chart.
- Y-Axis Value: value (price or indicator) corresponding to the mouse current position.
- Indicator Values: (only for compatible indicators) if selected, indicator values corresponding to the current bar are shown.
- Open: current bar open.
- High: current bar high.
- Low: current bar low.
- Close: current bar close.
- Up Volume: sum of tick volumes whose price is greater than the price of previous tick (in current bar).
- Down Volume: sum of tick volumes whose price is lower than the price of previous tick (in current bar).
- Unchanged Volume: sum of tick volumes whose price is equal to the price of previous tick (in current bar).
- Volume: current bar total volume.
- Up Tick: number of ticks whose price is greater than the price of previous tick (in current bar).
- Down Tick: number of ticks whose price is lower than the price of previous tick (in current bar).
- Unchanged Tick: number of ticks whose price is equal to the price of previous tick (in current bar).
- Total Ticks: current bar total ticks.
- Open Interest: (rarely provided by data-feeds) current-bar open-interest. Usually only present in daily data.
- Bar Number: current-bar ordinal number.


