

Indicators & Trading Systems window contains the full list of all indicators and trading systems available in the platform.
To access Indicators & Trading-Systems window:
- Workspace window > View menu > Indicators & Trading Systems
- or press Indicators & Trading Systems button on Charts toolbar.
The window consists of two Tabs:
- Indicators: contains the full list of all indicators available in the platform (both built-in and developed by user with Developer)
- Trading Systems: contains the full list of all trading systems developed by user with Developer
Sections #
The Indicator / Trading-System list is divided into the following macro sections:
- Favorites: initially empty, it contains indicators / trading-systems you use most frequently. You can move an item to your favorites:
- by Drag & Drop
- or by right clicking on the object > Add to Favorites
- or by pressing Add to Favorites button (star icon) on the left toolbar
- Indicators / Trading-Systems: contains all indicators / trading-systems available and ready to use.
- Not Available: contains all indicators / trading-systems present in the platform but NOT really available. These are indicators / trading-systems developed by user with Developer that contain errors or have not been correctly compiled (the compilation transforms the object source code into something the program can understand).
Within the list, objects can be divided into folders and subfolders: You can divide the objects according to your needs by creating as many folders and subfolders as you wish.
To add a forlder:
- right click on the list > Add Folder
- or press Folders button on the left toolbar > Add Folder
To rename a folder, select the folder:
- right click > Rename Folder
- or press Folders button on the left toolbar > Rename Folder
To remove a folder (and all its subfolders), select the folder:
- right click > Remove Folder
- or press Folders button on the left toolbar > Remove Folder
User Indicators / Trading-Systems #
The indicator / trading-system list contains both built-in and created by user (using Developer) objects. You can easily identify user-created items by the presence of a colored dot before the item name in the list:
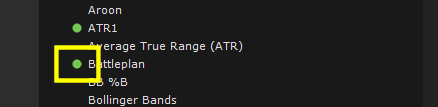
Dot color identifies the object status. Hovering over the dot with the mouse shows the status description. In short, if the dot is GREEN the object is up-to-date otherwise you should recompile it using Developer (compilation is the process that transforms the source code into ‘something’ the program can understand).
Quick access to source code #
To quickly access the source code of a user-created object:
- Select the object in the list > right click > Edit/Show Source Code
- or Select the object in the list > press Edit/Show Source Code button on the left toolbar.
Add an object to a chart #
To add an indicator / trading-system to a chart:
- Select the object
- Drag & drop the object over the chart window where you want to add it.
To add an indicator on indicator (such as the moving average of an indicator), drag & drop the object over the reference indicator onto the chart window.
As an alternative to drag & drop, to add an object to a chart:
- Select the object in the list > right click > Add to Chart
or Select the object in the list > press Add to Chart button in the top toolbar. - Select the location (inner-window) and reference object of the indicator / trading-system from properties window that opens automatically.
Manually Draw an Indicator #
Some indicators can be drawn directly on chart like any drawing-tool (trendline etc.). You can easily identify these indicators by the presence of a pen icon after the item name in the list:
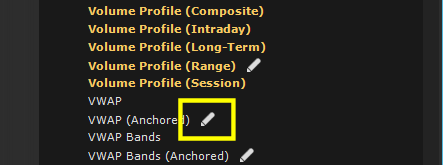
To start manual drawing:
- click on the pen icon corresponding to the indicator to be drawn
- or Select the indicator in the list > right click > Start Manual Drawing
- or Select the indicator in the list > press Draw Manually button in the top toolbar.
After starting the drawing, draw the indicator directly on chart like any drawing-tool.


