Chart window can be divided into several columns. Each column has its own X axis (time scale).
How to change the time scale (X axis) #
The horizontal axis is divided into 3 areas: left, center and right
To compress or decompress the X axis, or more commonly perform a chart Zoom-In or Zoom-Out:
- Place the mouse over the chart window and scroll the mouse wheel up and down
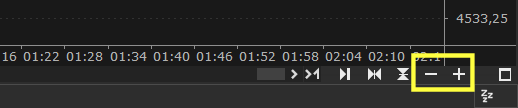
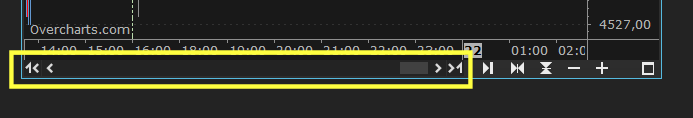
- or press + and – buttons on the right of X-axis scroll bar:
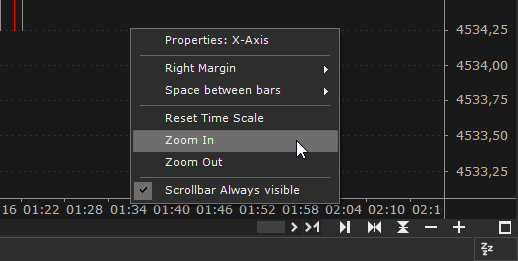
- or right click on X-axis > Zoom-In/Zoom-Out:
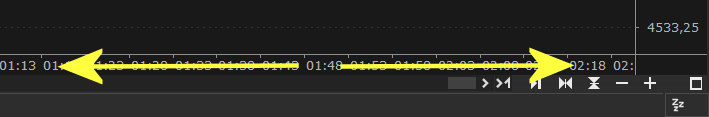
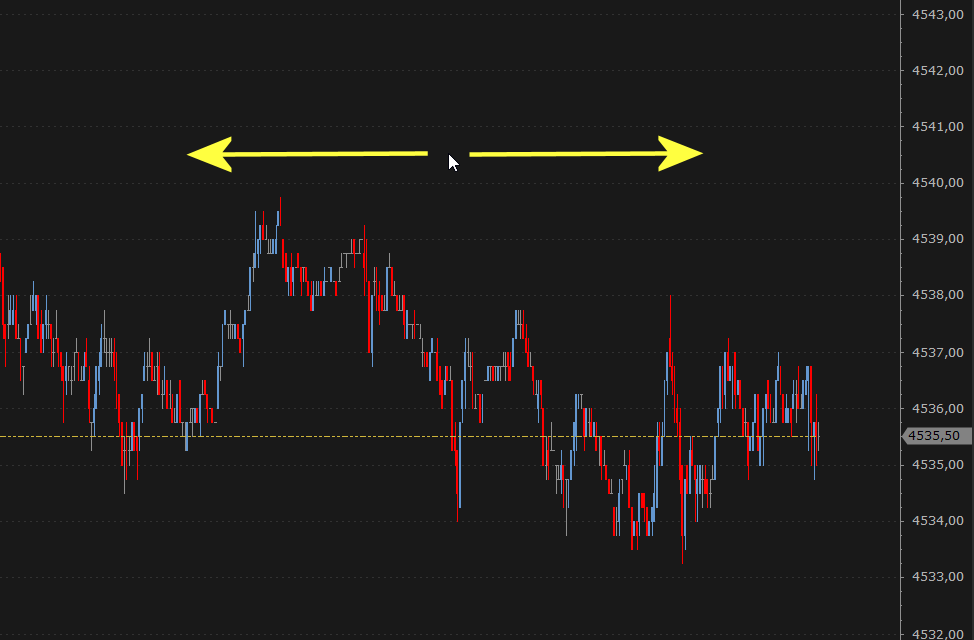
- or left click on x-axis left or right area and move the mouse cursor to the left or right:
- or use the Hot Keys ‘CTRL +’ and ‘CTRL –‘
To move X-axis horizontally while keeping the current time interval:
- left click on chart window and move the mouse left or right
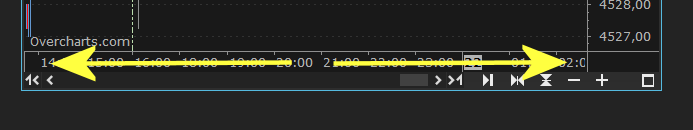
- or move X-axis scroll bar left or right:
- or left click on x-axis central area and move the mouse cursor to the left or right (you can also directly use the mouse scroll wheel on central X-axis area):
- or use the hot keys ‘CTRL + Left Arrow‘ and ‘CTRL + Right Arrow‘
You can change mouse wheel sensitivity on chart by setting the Mouse Wheel Sensitivity property in the Preferences window accessible from: Tools menu > Preferences > Chart section. The greater the mouse wheel sensitivity on chart, the greater the zoom
Manual Zoom #
Manual zoom allows you to zoom-in on a specific chart area by defining the area directly on chart using the mouse:
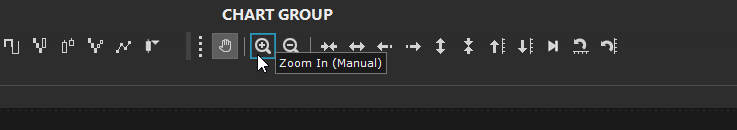
1. Activate manual zoom by pressing Zoom-In (Manual) button on Zoom and Control toolbar
2. Draw the area on chart using the mouse:
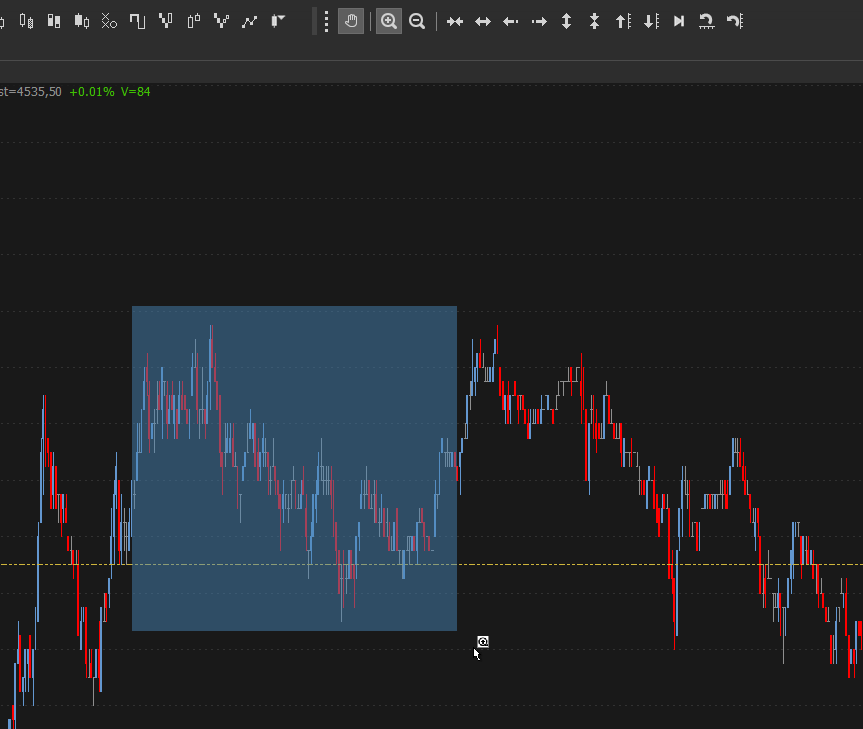
3. Disable manual zoom by pressing Zoom-In (Manual) button again on Zoom and Control toolbar
To undo the zoom, press Zoom-Out (Manual) button on Zoom and Control toolbar.
Right Margin #
Right margin in a chart represents a time interval (expressed in number of bars) added to the right of chart after last bar. This additional space allows you, among other things, to draw and/or extend drawing tools (trendline etc.) beyond the chart last bar.
You can change the Right Margin in one of the following ways:
- right click on X-axis > Right Margin
- or right click on X-axis > Properties > Right Margin
Further Right Margin #
In addition to the Right Margin, you can define an additional margin to the right of chart. This margin, unlike Right Margin, is NOT represented by any time interval. Further-Right-Margin management is completely automatic and transparent to the user (if DYNAMIC type). If, on the other hand, it is of the FIXED type, further-right-margin is equal to a fixed number of bars defined in the relative property. We RECOMMEND you always use the DYNAMIC type (default), unless you have particular needs.
To change/set Further-Right-Margin as FIXED::
- right click on X-axis > Properties > Further Right Margin
To change/set Further-Right-Margin as DYNAMIC:
- Move the mouse cursor near the chart last bar, then left click on chart window and move the mouse left or right
To reset Further-Right-Margin, reset time scale as described in point 2 of Reset Time Scale section
Reset Time Scale #
There are two types of time scale (X axis) reset:
1. Reset the scale to display all available bars in the chart:
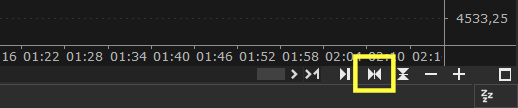
- press Reset time scale button on the right of X-axis scroll bar:
- or select Format menu > Reset Time Scale
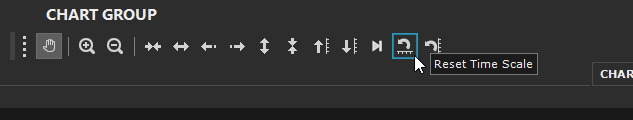
- or press Reset Time Scale button on Zoom and Control toolbar:
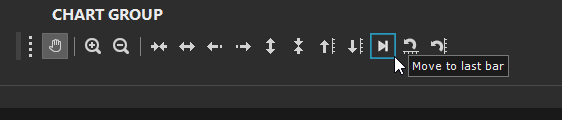
2. Reset of the scale (both X and Y axis) and positioning on chart last bar (with resetting of dynamic Further-Right-Margin, if present):
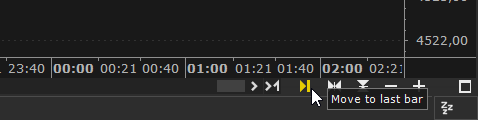
- press Move to last bar button on the right of X-axis scroll bar:
- or select Format menu > Move to last bar
- or press Move to last bar button on Zoom and Control toolbar:
Space between bars #
Bars in a chart are spaced from each other by a Standard space. You can change the space between bars according to your needs by multiplying the standard space by x times.
You can change the space between bars in one of the following ways:
1. right click on X-axis > Space between bars > select the multiplier
2. right click on X-axis > Properties > Space between bars
No Scoll on New Bar #
By selecting this property, chart will NOT automatically scroll to the left when adding a new bar in real time.
You can enable/disable automatic chart scrolling in one of the following ways:
1. right click on X-axis > No Scroll on New Bar
2. right click on X-axis > Properties > No Scroll on New Bar
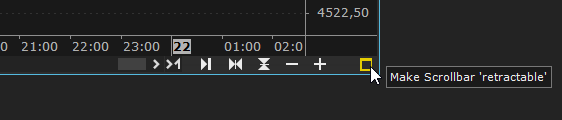
Scroll bar always visible or “retractable” #
To save space on chart you can hide the chart scroll bar:
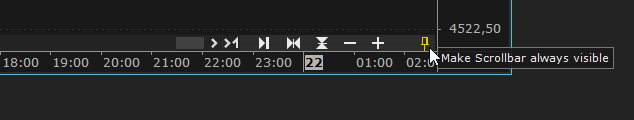
- By pressing ‘Make Scrollbar Retractable‘ button on the right of chart scroll bar:
- or right click on X-axis > ‘Scrollbar Always visible’
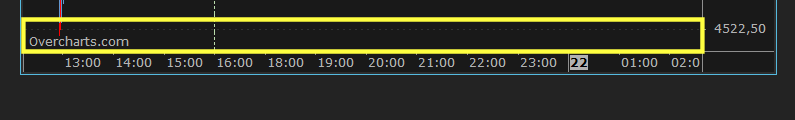
When the scroll bar is ‘retractable’ to make it visible, hover the mouse over the part immediately above the X axis::
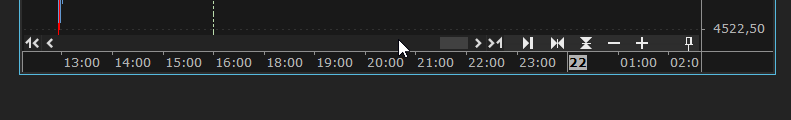
To make the scroll bar permanently visible again:
- Press Make scrollbar always visible on the right of chart scroll bar: