

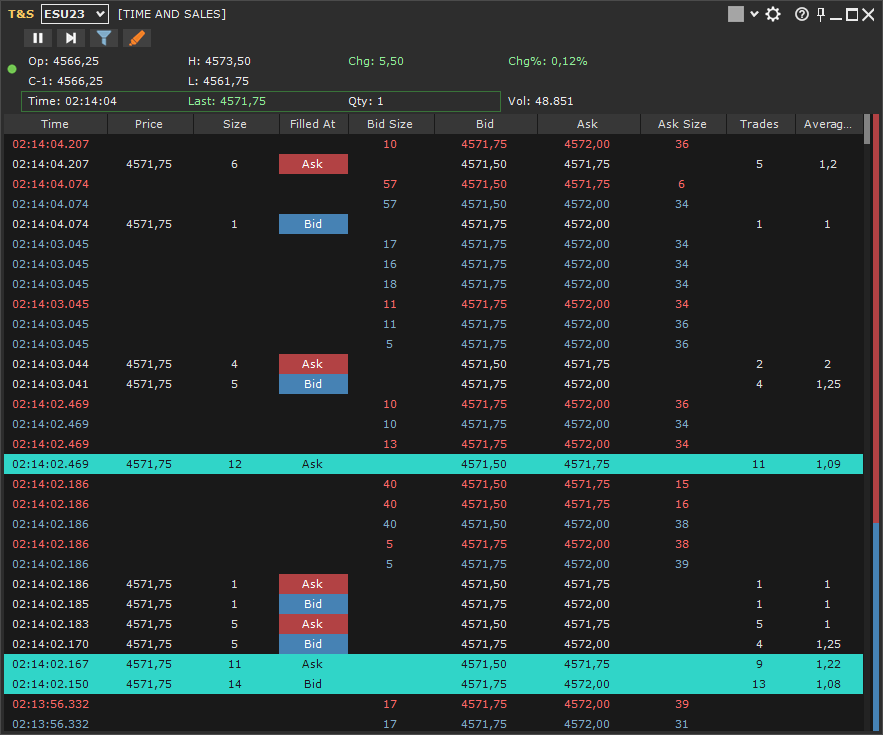
Time & Sales shows in detail Tick-by-Tick data flow in real time of the single instrument. In other words, it displays all filled trades by reporting the price, size, execution time and whether the trade was filled at Bid or Ask, thus identifying the aggressor.
The aggressor buys at current Ask price and sells at current Bid price.
It is also possible to aggregate the data/records, filter them and highlight those meet specific conditions.
Create a new window #
You can create a new Time & Sales window in one of the following ways:
- from Workspace window > New menu > Time & Sales
- or by pressing the appropriate button in the Tool-Windows toolbar of Workspace window
Columns #
You can size and move the columns as you like.
You can reset column settings (width and position) from Settings menu (gear button at the top right of the window) > Reset column settings
Available Columns:
Time: trade execution time. Time format can be in seconds, milliseconds or microseconds.
Price: trade execution price.
Size: filled quantity.
Filled at: indicates where the trade was filled, i.e. whether it was filled at ASK, Above-ASK, at BID, Below-Bid or between BID and ASK.
- If the trade was filled at ASK or Above-ASK, the aggressor was the buyer.
- If the trade was filled at BID or Below-BID, the aggressor was the seller.
- If the trade was filled between BID and ASK, it was not possible to pinpoint exactly who the aggressor was.
Bid Size: best bid size (column contains values only if you choose to display bid/ask data).
Bid: best bid price.
Ask: best ask price.
Ask Size: best ask size (column contains values only if you choose to display bid/ask data).
Trades: if data is aggregated, it indicates the number of trades aggregated together. If data is NOT aggregated, it is always equal to 1.
Average Size: (= Size / Trades) if data is aggregated, it indicates the average size filled for each trade. If data is NOT aggregated, it is always equal to Size column.
Properties #
You can access the configuration properties, in one of the following ways:
- Settings menu (gear button at the top right of the window) > Properties
- or right-click on T&S grid > Properties
Available Properties:
Data #
Aggregate Trades: set this property to aggregate time and sales data. Possible values:
- Do Not Aggregate: trades are NOT aggregated. The original trade flow is displayed.
- Time / Price / Filled-At: trades are aggregated by Time, Price, Filled-At
- Time / Price: trades are aggregated by Time, Price
- Time / Filled-At: trades are aggregated by Time, Filled-At
- Price / Filled-At: trades are aggregated by Price, Filled-At
Aggregation breaks when one of involved values changes. If Bid/Ask data is also visible (in addition to trades), aggregation also breaks when Bid/Ask values and/or their sizes change.
Same Timestamp if: (property visible ONLY if trade execution time is part of aggregation values) defines how to compare trade execution times to each other:
- within Same Second: the execution time is rounded to the ‘second’. Then all trades executed in the same second are aggregated together (if all other values involved are the same).
- within x milliseconds: trades with execution times belonging to the same time interval are aggregated together (if all other values involved are the same). Time interval starts from the time of first aggregated trade and extends for x milliseconds.
Show ‘Trade’ data: if checked, trades are displayed in the window.
Show ‘Bid’ data: if checked, Bids (price + size) are displayed in the window.
Show ‘Ask’ data: if checked, Asks (price + size) are displayed in the window.
Maximum Number of Rows: maximum number of rows to display in the grid.
Add new rows.. on Top: if checked, new data is added at the top of the grid, otherwise at the bottom.
Double-Click to Clear Data: if checked, a double-click on the grid will clear the T&S data.
Daily Values: (session) choose whether or not to display values such as Open, High, Low, Previous Close, Total Volume, Time and last price/quantity traded, difference with the previous close:
- None: no session data is displayed
- All: shows all available values
- Time/Last/%/Size/Volume: only shows information about last trade, difference in % with the previous close, and session total volume.
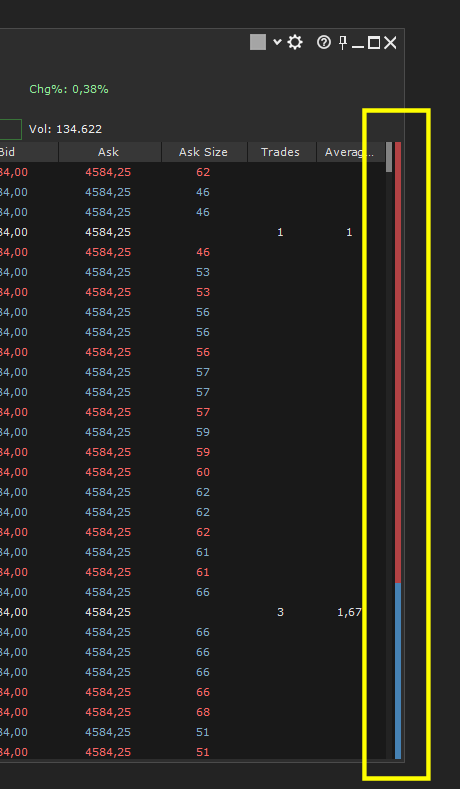
Show Buyers/Sellers Strength: if checked, buyers/sellers strength vertical bar is shown. The bar is calculated using last x seconds trade quantities.
Style #
Text Size: defines the font size to use.
Theme: choose whether to display grid in standard or zebra mode. If zebra, two shades of color are used for background resulting in a zebra effect on the grid.
Show Buttons: if checked, toolbar is shown.
Show Vertical gridlines: if checked, column vertical lines are drawn in the grid.
Show Horizontal gridlines: if checked, row horizontal lines are drawn in the grid.
Show Column Headers: if checked, column headers are shown in the grid.
Autosize Columns: if checked, column widths are calculated in order to fully use all available space in the grid.
Time Format: defines the time format. Possible formats: Seconds, Milliseconds, Microseconds.
Colors: customize colors used in the grid as you like:
- ‘Filled at’ Color: Bid, Below-Bid, Ask, Above-Ask, Between Bid/Ask: defines ‘Filled at’ column background color according to the trade price.
- ‘Price Up’, ‘Price Down’ Color: defines ‘Price’ column background color when current trade price is higher or lower than previous price.
- ‘Bid Record‘, ‘Ask Record‘ Color: defines row font color when data comes respectively from bid or ask stream.
Window #
Always On Top: If checked, T&S window is always kept on top of belonging Workspace. Property has no effect if T&S window is docked to Workspace window.
You can save current T&S window settings as default from Settings menu (gear button at the top right of the window) > Save Settings as Default
All T&S windows opened after saving will have the new default settings.
Filter data #
You can filter data by choosing to view only trades that meet specific conditions. For example, you can set the filter to display only trades with size greater than or equal to a specific value, or which were filled above or below a specific price, or which were filled at Bid or Ask, etc.
You can access Filter settings window, in one of the following ways:
- Settings menu (gear button at the top right of the window) > Filter data
- or right-click on T&S grid > Filter data
- or (if a filter is already present) from Filter data button on top toolbar.
To filter the data you have a maximum of 3 groups of conditions linked together by AND / OR. For each group you can define up to 3 conditions linked together by AND / OR. In other words, you have up to 9 conditions available to filter the data.
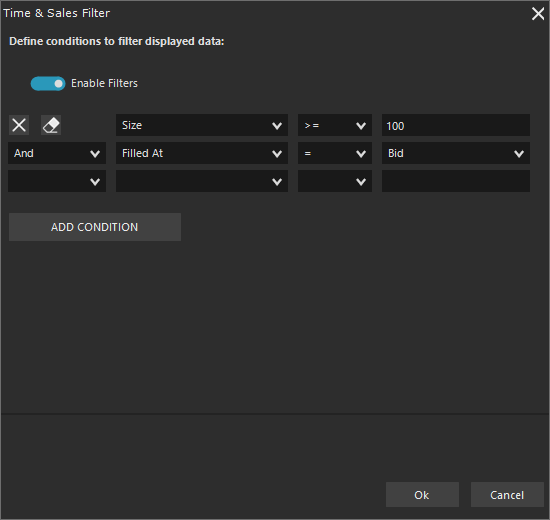
Example 1:
To view only trades with size greater than or equal to 100 and filled at BID, you will set filter as shown in the image below:
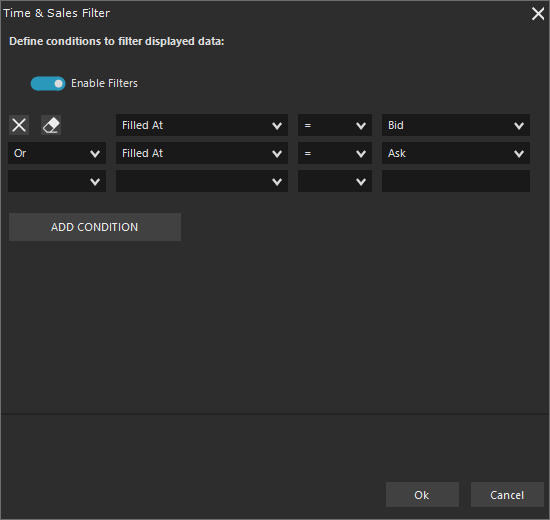
Example 2:
To view only trades filled at ASK and BID excluding all trades filled Above-ASK, Below-BID or between BID and ASK, you will set filter as shown in the image below:
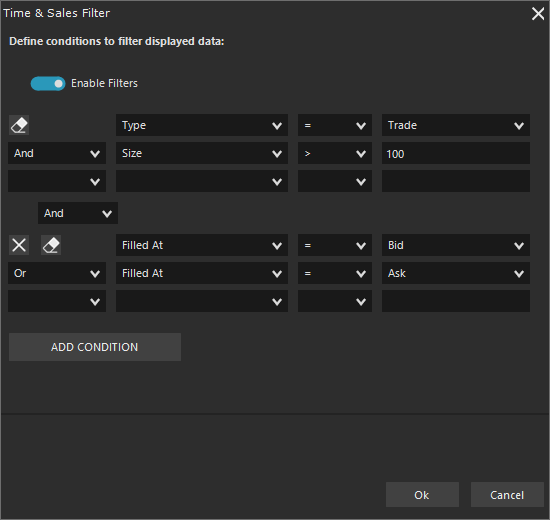
Example 3:
To view only trades with size greater than 100 and filled at BID or ASK (excluding all trades filled Above-ASK, Below-BID or between BID and ASK), you will set filter as shown in the image below:
Highlighters and Alerts #
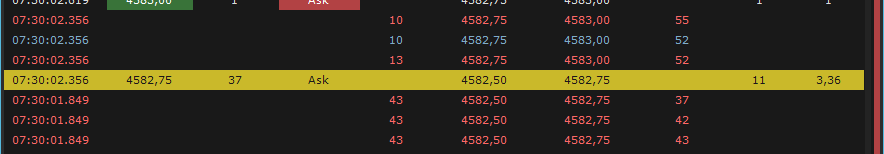
In the T&S grid, you can highlight data that meets specific conditions. For example, you can highlight trades with size greater than a specific value in the color of your choice.
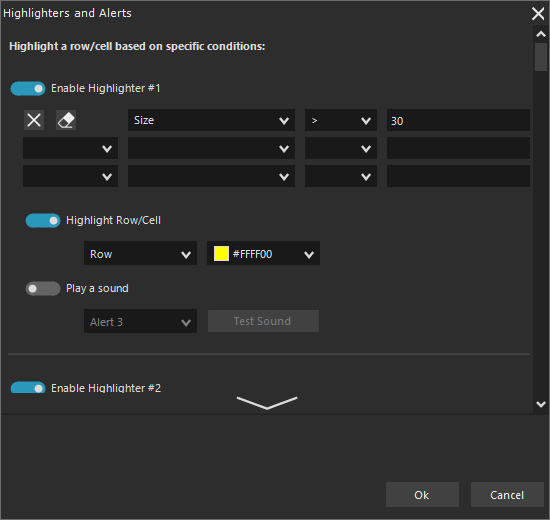
You have up to 3 highlighters available. For each highlighter you can define 3 conditions linked together by AND / OR.
Highlighters are processed in order from first to last. This means that if a data satisfies the conditions of several highlighters, the last one will take precedence over the others.
Example: if a trade has size 60 and two highlighters are configured, one which colors the row yellow if trade size is greater than 30, and the other which colors the row red if trade size is greater than 50, the row will be red.
To highlight a row that meets specific conditions, follow these steps:
- Access Highlighters and Alerts configuration window, in one of the following ways:
- Settings menu (gear button at the top right of the window) > Highlighters and Alerts
- or right-click on T&S grid > Highlighters and Alerts
- or (if an highlighter is already present) from Highlighters and Alerts button on top toolbar.
- Press Add New button
- Define the conditions
- Choose, by selecting the appropriate check-box, if you want to highlight the entire row with a specific color or just a cell (indicating the column).
- Choose, by selecting the appropriate check-box, if you want to play a sound.
- If you want to insert another Highlighter, repeat all steps from step 2.
- Press OK.
Buyers / Sellers Strength #
On the right side of the grid you can display a two-color vertical bar which graphically shows trade sizes executed on Bid and Ask in the last x seconds. A prevalence of Bid (the lower part of the bar is longer than the upper one) indicates a greater strength of Sellers, conversely a prevalence of Ask indicates a greater strength of Buyers.
Pause #
You can pause T&S to better analyze the collected data:
- By pressing Pause button at the top left of the T&S window (if visible)
- or from Settings menu (gear button at the top right of the window) > Pause
- or right-click on T&S grid > Pause
To reactivate T&S:
- Press Continue button at the top left of T&S window (if visible)
- or from Settings menu (gear button at the top right of the window) > Continue
- or right-click on T&S grid > Continue
Clear Data #
You can clear all data on the grid:
- from Settings menu (gear button at the top right of the window) > Clear Data
- or right-click on T&S grid > Clear Data
Templates #
You can quickly set all T&S window properties using a previously saved template.
Save a Template #
To save a template, follow these steps:
1. Access Settings menu (gear button at the top right of the window) > Template > Save as
2. You can decide whether to create a new template by defining its name or overwriting an existing one
3. Press OK
Apply a Template #
To apply a template to T&S window, follow these steps:
1. Access Settings menu (gear button at the top right of the window) > Template > Apply
2. Select the template and press OK
Manage your Templates #
From Template Manager window, you can:
- Rename or Delete a template.
- Import / Export a template.
To access the template manager window:
- from Settings menu (gear button at the top right of the window) > Template > Manage
Link T&S to a Chart / DOM / Watchlist #
Using instrument-Link you can link a T&S window to one or more Chart, DOM, Watchlist, Order-Entry, other T&S etc. windows. Instrument-Link allows you to automatically change the instrument on linked Charts, DOMs, Watchlists.
To link T&S to a chart, please follow these steps:
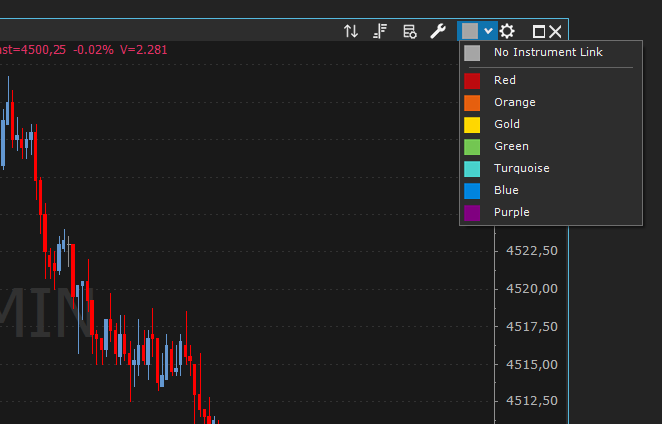
1. Select a color from instrument-link available color list at the top right of T&S window:
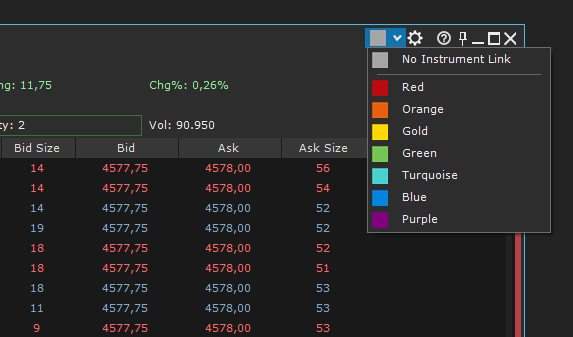
2. Select the same color chosen for T&S, on instrument-link at the top right of chart window:
3. That’s all! Now the two windows are linked to each other.
4. To link other windows, set the same color chosen in the T&S also in the other windows, exactly as you did with chart.


