In Overcharts, an instrument chart is always contained in a Chart-Group which in turn is contained in a Workspace
Open a new Chart #
To open a new chart within a Workspace, follow these steps:
1. Connect to data-feed from Overcharts main window > Connections Tab
2. From Overcharts main window > Charts & Trading Tab, access the Workspace where you want to open the chart
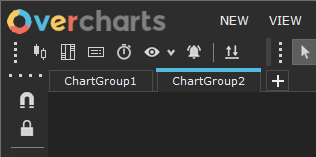
3. Using Chart-Group Tabs at the top left of Workspace window, select the Chart-Group where you want to open the chart, or create a new one
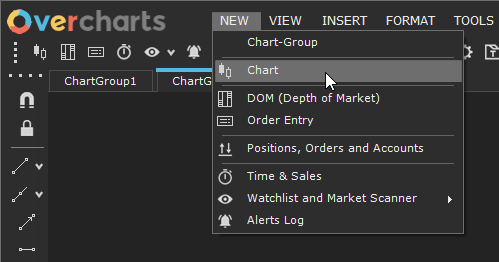
4. Select from menu bar: New > Chart
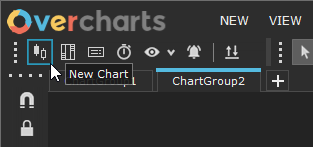
or press New Chart button on Tool-Windows toolbar:
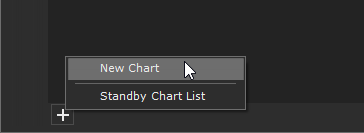
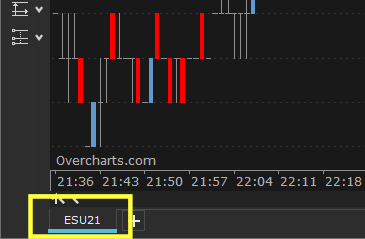
or press “+” button on Chart Tabs (at the bottom left of Workspace/Chart-Group window) and select New Chart menu item:
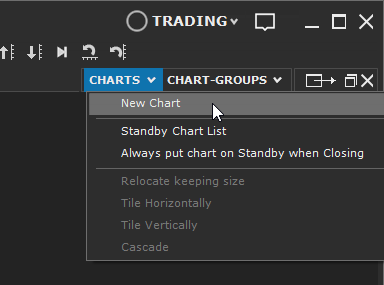
or select Charts > New-chart menu item (at the top right of Workspace/Chart-Group window):
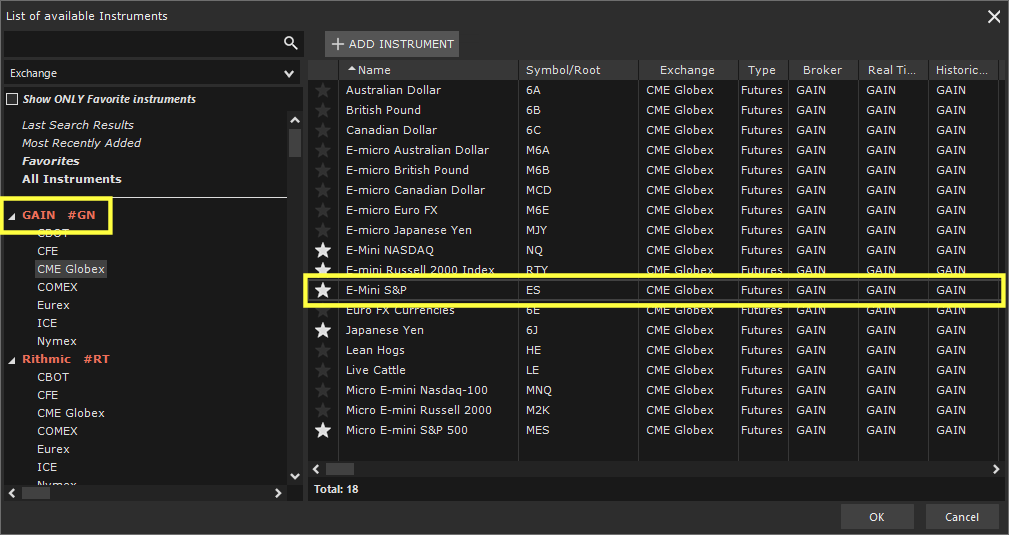
5. Select from instrument list, the instrument to use to create the new chart.
Select the instrument based on the CONNECTION it belongs to!
Each instrument belongs to only one connection. Different connections can have instruments with the same name or symbol. Make sure you select right instrument, that is the one belonging to your data-feed CONNECTION
6. Press OK button.
A new chart window will be created and its configuration window will open automatically. You can change settings before confirming them by pressing OK button.
Put a Chart on Standby #
When you manually close a chart, you can choose whether to permanently delete it or put it on Standby (closing it while keeping all its settings). This will allow you to reopen it in the future without having to reconfigure all its properties and indicators.
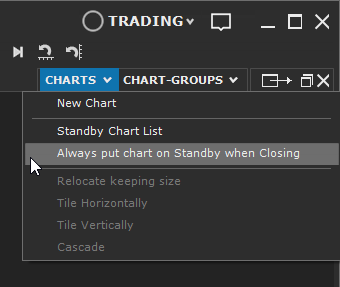
By selecting Charts > Always put chart on standby when closing, you can choose to automatically put chart on standby when manually closing it.
Open a Standby Chart #
To open a chart previously put on standby, follow these steps:
1. Each Chart-Group has its own standby chart list, so select the Chart-Group where the chart was contained before being put on standby
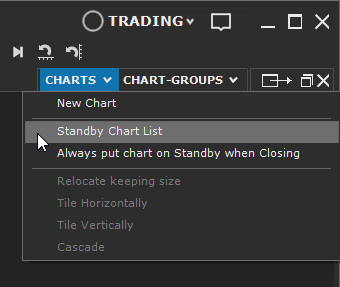
2. Access Standby-Chart-List from Charts menu > Standby Chart List (at the top right of Workspace/Chart-Group window):
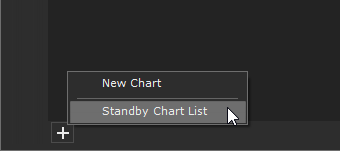
or press “+” button on Chart Tabs (at the bottom left of Workspace/Chart-Group window) and select Standby Chart List menu item:
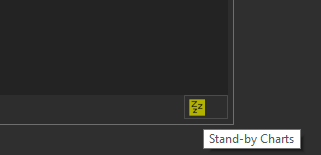
or press Standby Charts button (at the bottom right of Workspace/Chart-Group window). If Chart-Group contains standby charts, the button will be highlighted:
3. In the chart-list shown (to the right on Chart-Group window) press Open button corresponding to the chart you want to reopen:
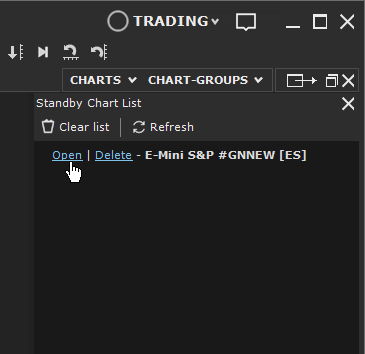
You can also permanently delete the chart by pressing Delete button corresponding to the chart you want to delete or delete entire list by pressing Clear-list button.
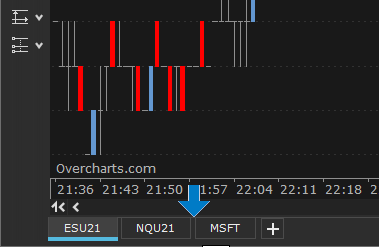
Rename Chart Tab #
To better identify a chart, or if there are more charts of the same instrument, you can customize text displayed in the chart Tab:
To customize the text, follow these steps:
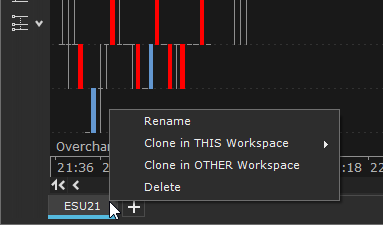
1. Access Tab-Name property in the configuration window by right clicking on Chart Tab > Rename:
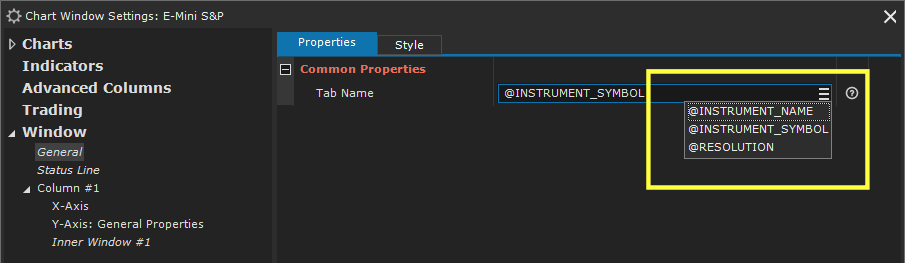
2. Change Tab-Name property as you wish. You can write any type of text and use, in combination with text, Tags in the list on the right:
Example:
The following combination of text and Tags:
@INSTRUMENT_SYMBOL @RESOLUTION – VOLUME PROFILE
displays the following result:
ESU21 1 Minute – VOLUME PROFILE
Delete Chart #
To delete a chart, simply close it manually by answering YES to the permanent cancellation confirmation question.
Alternatively, you can delete a chart in the following way:
Right Click on Chart Tab > Delete:
or from Maintenance menu > Delete (at the top right of chart window):
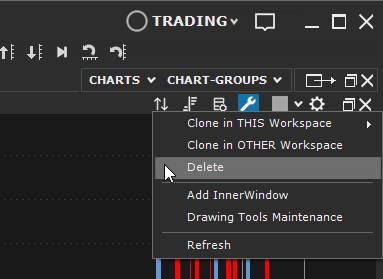
Clone a Chart #
Clone chart function allows you to clone the chart:
- within the same Chart-Group
- in a different Chart-Group within the same Workspace
- in a Chart-Group contained in another Workspace (in this case you can clone the chart ONLY in Workspaces/Chart-Groups open at the time of cloning)
Cloning a chart means cloning the entire chart window, including indicators, drawing tools etc.
To clone a chart, follow these steps:
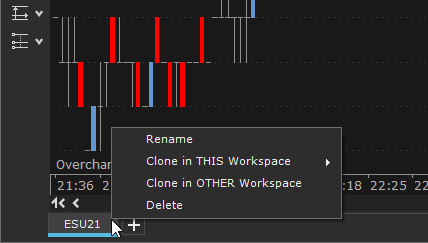
1. Right Click on Chart Tab:
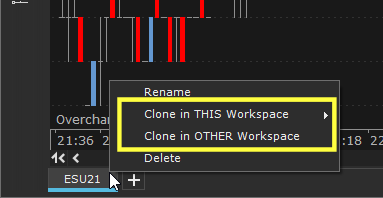
or on Maintenance menu (at the top right of chart window):
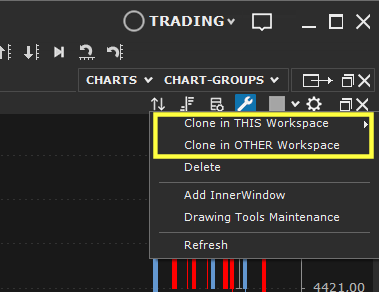
2. Select Clone in THIS Workspace (to clone the chart in the same Workspace, then choosing the Chart-Group)
or Clone in OTHER Workspace (to clone the chart in one of currently open Workspaces/Chart-Groups)
Manage Chart-Group window location #
You can place a chart wherever you want within the Chart-Group also defining its size. In this way you can simultaneously view multiple charts contained in the Chart-Group.
However, unless you have particular needs, we recommend you maximize the chart so as to occupy all space available in the Chart-Group window.
You can arrange charts using one of the following automatic positioning functions accessible from Charts menu:
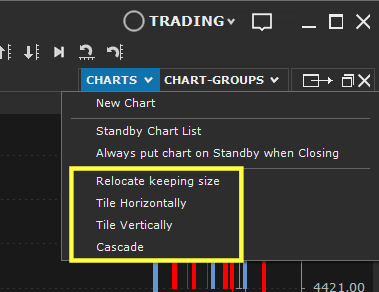
- Relocate keeping size: Relocates charts keeping their size unchanged
- Tile Horizontally: Relocates charts horizontally, sizing them appropriately so as to occupy all available space as a whole
- Tile Vertically: Relocates charts vertically, sizing them appropriately so as to occupy all available space as a whole
- Cascade: Relocates charts as a cascade by sizing them appropriately
Relocate Chart Tab #
You can relocate Chart Tab as you like using Drag & Drop (by selecting the Tab and dragging it to the right or left while holding down left mouse button and then releasing it once the desired location is reached):