

All calculation and style properties of each single chart are contained, like all other settings, in the Chart Window Settings. For detailed information on configuration window, please refer to its documentation.
You can quickly access chart settings, in one of the following ways:
- By double-clicking on chart
- By clicking on chart status-line
- By Right Clicking on chart > ‘Properties: + chart name‘
Settings #
Settings are divided into 3 sections (Tabs): Properties, Style, Y-Axis.
Calculation Properties #
Properties Tab contains all chart calculation properties. Below are the available properties:
Chart #
Chart Type: Specifies the type of chart to draw. For some chart types, you need to set specific input parameters. Below are the available chart types:
On the Internet you can find a lot of documentation about all chart types available in Overcharts. To learn more about the calculation and construction of the various charts, we suggest you do some research.
- Line: continuous line joining all bar close values.
- Bar-Chart: classic bar-chart.
- Candlestick: classic Candlestick.
- Trend Hollow Candlestick: chart similar to Candlestick with the difference that, if Close is greater than Open, candle is drawn empty. The candle color depends on the comparison between current close (C) and previous candle close (C-1).
- CandleVolume: Candlestick-like chart where the width of each candle highlights the volume traded. The wider the candle, the greater the volume traded.
- EquiVolume:
- Bar Style: specifies bar drawing style:
- High/Low: the bar is represented by a rectangle joining the high value (H) and low value (L). The candle color depends on the comparison between current close (C) and previous candle close (C-1).
- High/Low/Close: the bar is represented by a rectangle joining the high value (H) and low value (L). The filling of the rectangle is partial and depends on the comparison between current close (C) and previous candle close (C-1). If C is greater than C-1, bar is positive and the area between low (L) and close (C) is filled. If C is lower than C-1, bar is negative and the area between high (H) and close (C) is filled.
- Close, Previous-Close: the bar is represented by a rectangle joining current close (C) and previous close (C-1). Its color depends on the comparison between C and C-1.
- Bar Style: specifies bar drawing style:
- Point & Figure:
- Box Size: represents the price range corresponding to an X or O on chart.
- Reversal Amount: number of boxes (X or O) needed to reverse the trend.
- Input data type: data type to be used for calculating the chart (High + Low or Close).
- Kagi:
- Reversal Amount: minimum price movement (in absolute value or percentage depending on Calculation-Method) necessary to reverse the trend and start drawing a new line in the opposite direction to the current one.
- Calculation Method: specifies the method by which Reversal Amount is calculated:
- Fixed: Reversal-Amount is already the actual minimum price movement (in points).
- Percentage: Reversal-Amount is the percentage to be used for calculating the minimum price movement.
- Renko:
- Brick size: minimum price movement (in absolute value or percentage depending on Calculation-Method) necessary to add a new brick to the chart.
- Calculation Method: specifies the method by which Brick size is calculated:
- Fixed: Brick-size is already the actual minimum price movement (in points).
- Percentage: Brick-size is the percentage to be used for calculating the minimum price movement.
- Three Line Break:
- Lines: number of lines to break to reverse the trend (usually 3).
- Heikin-Ashi: classic Heikin-Ashi. If you need to learn more about Heikin-Ashi calculation formula, please search on the Internet.
- Dot-on-Close: a point is drawn at the bar close.
- Reversal Bar: candlestick-like chart, with a special calculation method: a new bar is added only if the current bar reaches or exceeds a minimum length and only if the retracement from the high/low value reached in the bar is greater than or equal to a Reversal Amount.
- Minimum length (in tick): specifies the minimum length (in ticks) the bar must reach before starting a new reversal bar.
- Reversal Amount (in tick): retracement from the High/Low price reached in the bar necessary for a new bar to start. In other words, a new bar only starts when prices reverse from the High/Low price reached for the specified amount of ticks.
Resolution #
Resolution is usually the time interval represented by each bar in the chart. We say ‘usually‘ because actually Tick, Contract, Point resolutions do not represent a specific time interval, but an amount of ticks, contracts (volume), points (range). In these particular types of resolution each bar contains a specific number of ticks, contracts, points and can last an indefinite time (bar is closed only when it reaches the specified amount).
Resolution Type + Resolution Units: specify the chart resolution. For example, if Resolution-Type is Minute and the Resolution-Units is 5, each bar in the chart represents 5 minutes.
Available Resolutions:
- Tick: resolution-units represents the number of ticks (trades) contained in each single bar. The bar closes when the specified amount of ticks is reached.
- Contract (Volume Bar): resolution-units represents the amount of volume contained in each single bar. The bar closes when the specified amount of volume is reached. Volume can be expressed in number of contracts/shares or in cash depending on the data-feed.
- Point (Range Bar): resolution-units represents the price range (in points) of each single bar (1 Point = Tick-size = Minimum-Price-Movement of the instrument). The bar closes when the specified price range is reached.
- Second: each bar represents x seconds
- Minute: each bar represents x minutes
- Hour: each bar represents x hours
- Session: each bar represents x trading sessions
- Day: each bar represents x days
- Week: each bar represents x weeks
- Month: each bar represents x months
- Quarter: each bar represents x quarters
- Year: each bar represents x years
Build using time frame…: (to be used ONLY in special cases) represents the time frame of the data to be used to build the chart. Default value is Auto and we recommend NOT to change it unless there are special needs. For example, you can change it if you want to create a ‘Daily‘ or ‘Weekly‘ chart using 1-Minute data instead of 1-Day data. You should know that in 1-day data provided by data-feeds, usually the day Open and Close values DO NOT correspond to the first and last price traded during trading session, but are obtained from auctions and/or averages of last x trades (settlement). For this reason, a daily or weekly bar built using 1-day data may be different from the same bar built using 1-minute data (including bar total volume).
Quote Type: data type to be used to build the chart (Trade, Bid, Ask). Unless you have special needs, in 99% of cases you will always and only use Trade.
Data Range #
This section contains all properties that define the range of data to load for the chart.
Loading Type: specifies how to load historical data:
- Last x Days: load the last x days.
- Last x Months: load the last x months. Eg If x=1 and today is June 15th, data will be loaded starting from May 16th.
- Last x Years: load the last x yeas. Eg If x=1 and today is June 15th, data starting from June 16th of previous year will be loaded.
- Date Range: loads the specified date range.
- Days previous the specified date: (not recommended) loads x days prior to a specified date. To be used only if really necessary.
- Days from the specified date: (not recommended) loads x days starting from a specified date. To be used only if really necessary.
- Last x Bars: (not recommended) load the last x bars..
- Bars previous the specified date/time: (not recommended) loads x bars prior to a specified date/time. To be used only if really necessary.
- Bars from the specified date/time: (not recommended) loads x bars starting from a specified date/time. To be used only if really necessary.
Trading Session: specifies the Trading Session (Trading Hours) to use for the chart. Session times MUST be in the time zone of city/area where the exchange is located. Usually the default trading session is used, that is the one specified in the instrument configuration. Trading session affects the loading / viewing of data, filtering it.
Holiday List: (usually not set) specifies the list of public holidays to use for the chart. Usually the default one should be used, i.e. the one specified in the exchange configuration to which the instrument belongs. Holiday list affects the loading / viewing of data, filtering it.
Chart Time Zone: represents the time zone in which the chart is displayed (X-axis). WARNING: it is NOT the instrument time zone and it DOES NOT affect the loading of data or trading hours.
Location #
Inner Window: specifies the INNER window containing the chart. A chart window can be made up of different sections (also divided into columns if necessary). Each section is called an inner-window.
Reference Object #
(optional – this property is NOT present in the window main chart configuration. It is present only in the configuration of sub-charts). The reference object of a sub-chart can only be another chart (usually the main chart). Usually this property is NOT set (default: None). However, for x reasons, you may want to draw two charts of the same instrument but with different resolutions in the same inner-window. In this case, it is FUNDAMENTAL for the two charts to have the same Y-axis scale otherwise they would be NOT synchronized with each other. To synchronize the two scales, you need to set in the sub-chart the Reference-Object to ‘main chart‘ and the Y-axis Scaling-Range property to ‘Same as Reference Object‘.
It makes sense to set the reference object of a sub-chart ONLY if the same inner-window contains several charts of the same instrument (even with different resolutions). By setting Reference-Object to ‘main-chart’, and Y-axis Scaling Range to Same as Reference Object, sub-chart will have the same Y-axis scale as the reference object. In other words, charts will be vertically synchronized.
Style Properties #
Style Tab contains all style properties of a chart.
WARNING: In addition to the properties listed here, there are many other properties that are minor or do not need further explanation.
Drawing #
Draw Chart: display or not the chart. This property is also easily accessible from chart Status-Line.
Style: depending on chart type, different sections are available where you can set the style of positive and negative periods/bars/candles. For example, if chart type is Candlestick, you will find Bullish-Candlestick-Style and Bearish-Candlestick-Style sections. If chart type is Barchart, you will find Bullish-Bar-Style, Bearish-Bar-Style and Neutral-Bar-Style sections, etc. These sections, due to their simplicity, do not require further explanation.
Show Last Value Marker (on Y-axis): specifies whether or not to show the last bar close on Y-axis.
Center Last Price on Scale: if checked, last price will always be kept in the center of Y-axis.
Show global drawings: if unchecked, global drawing tools (shared among multiple charts of the same instrument) will not be visible in this chart. For example, uncheck this property to NOT display in this chart the horizontal lines shared between multiple charts of the same instrument.
Backline: defines the style of horizontal line that starts from the close of last bar and extends back to the beginning of chart.
Session Breakline: defines the style of vertical line drawn on end-session bar.
Opacity of entire object (%): defines chart opacity.
Opacity Affects Drawing Tools: if checked, chart opacity affects drawings opacity. In other words, if for example chart opacity is 50%, drawings linked to chart will also be drawn with an opacity of 50%.
Colored zones #
Colored zones allow you to paint areas between two curves and/or horizontal lines. The most frequent use is, for example, to color the areas between chart and its moving average or any other indicator:
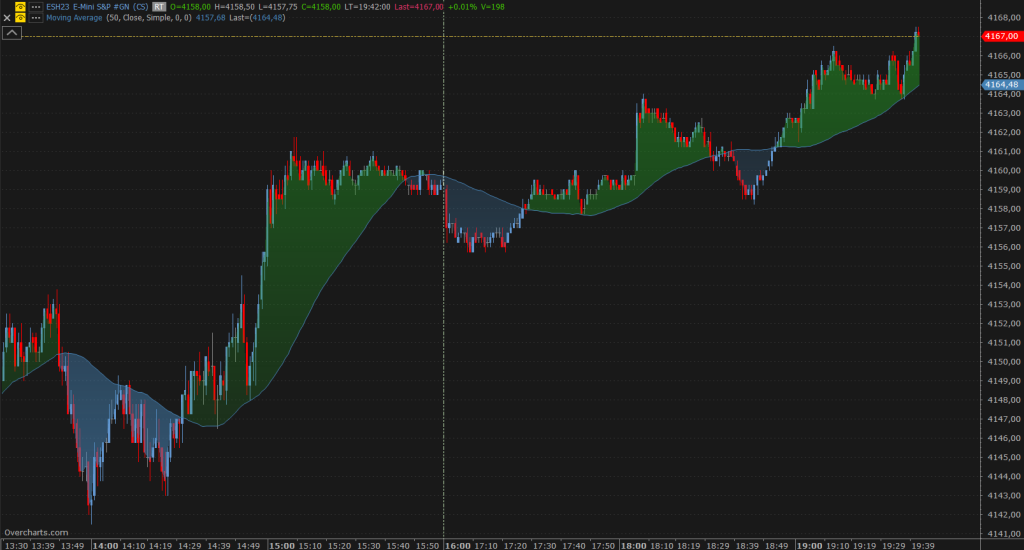
Up to 5 different colored zones are available.
Properties:
Paint Area: enables area coloring.
Chart Line: specifies which chart curve to use (Open / High / Low / Close). For example, by selecting ‘This Chart – CLOSE‘ chart curve used will be the one represented by close values.
Reference Line: specifies the curve to use in conjunction with Chart-Line to determine areas to paint. In other words, intersections of the two curves will determine the areas to be colored. Reference-Line can be an indicator, the backline, or one of chart values (O/H/L/C).
Enable Color > than reference: if checked, areas where Chart-Line is greater than Reference-Line will be painted:
Enable color < than reference: if checked, areas where Chart-Line is lower than Reference-Line will be painted:
Y-Axis #
Y-Axis Tab includes all chart specific Y-axis properties. Refer to this documentation for details.


