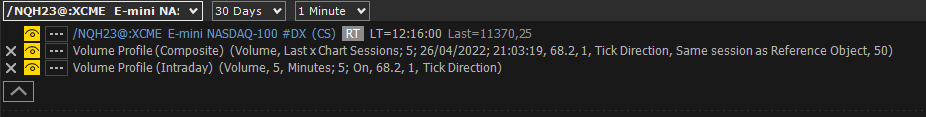
Status-line can be identified with the upper left area of a chart window and contains information about charts, indicators and trading-systems present in the window:
Each inner-window has its own status line. If there are several inner-windows in a chart window, each inner-window will have its own status-line containing information on objects present in that specific inner-window.
Each status-line element (line) corresponds to a chart, indicator or trading-system present in the window and shows information such as the object name, main calculation properties, object values corresponding to the mouse current position etc. By accessing status-line properties, you can choose which information to display.
While loading and calculating the chart/indicator, status line shows the process progress and highlights any errors or warnings.
Properties #
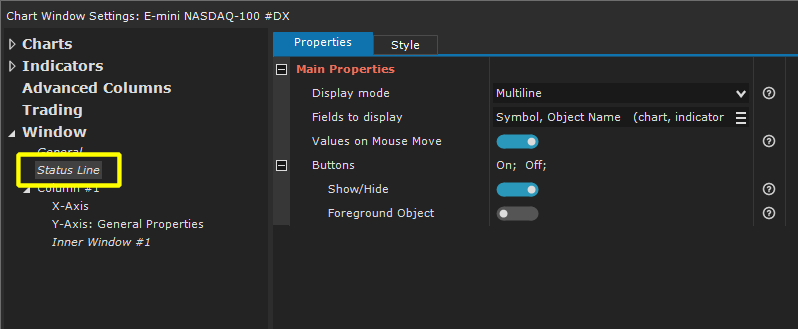
Status-line settings are found in the Chart Window Settings > Window > Status-Line section. To access the configuration window, refer to this documentation.
Available Properties:
Display Mode: 2 display modes available:
- Multiline: (recommended) each status-line element is drawn in a different line
- Single Line: all status-line elements are drawn in the same line. We do not recommend this display mode if there are more than 2 indicators/charts in the window.
Fields to display: specifies which information to display in the status-line:
- Symbol: (charts only) instrument symbol.
- Object Name: instrument, indicator or trading-system name.
- Input Values: main calculation properties of the object.
- Resolution: (sub-charts only) chart resolution.
- Real-time Status: (charts only) RT >> real time data subscription status (for the instrument).
- Reference Object: (indicators and trading-systems) shows chart/indicator reference object.
- Exchange: (charts only) instrument exchange.
- Connections/Data-feeds: (charts only) instrument connections/data-feeds (real time, historical-data and trading).
- Date: (charts only) date corresponding to the mouse current position on chart.
- Time: (charts only) time corresponding to the mouse current position on chart.
- Open: (charts only) current bar open.
- High: (charts only) current bar high.
- Low: (charts only) current bar low.
- Close: (charts only) current bar close.
- Indicator Values: (indicators only) indicator values on current-bar.
- Last tick time: (charts only) time of last real-time data received.
- Last value: (charts & indicators only) Last (if chart), last values (if indicator).
- Net Change (points): (charts only) difference (in points) between current bar close and previous bar close.
- Net Change (%): (charts only) difference (in percentage) between current bar close and previous bar close.
- Volume: (charts only) current bar volume.
- Bar Number: (charts only) current-bar ordinal number.
Values on Mouse Move: specifies whether to display object-values corresponding to the mouse current position on chart.
Buttons: specifies which quick buttons to display:
- Show/Hide: (eye icon) displays or hides the corresponding object.
- Foreground Object: brings the corresponding object to front (as a reference object for drawings).
There are also some style properties (colors, fonts, opacities) that need no further explanation.
Commands #
Through the Status-Line you can delete/display/hide an object, or quickly access its settings.
Delete an object #
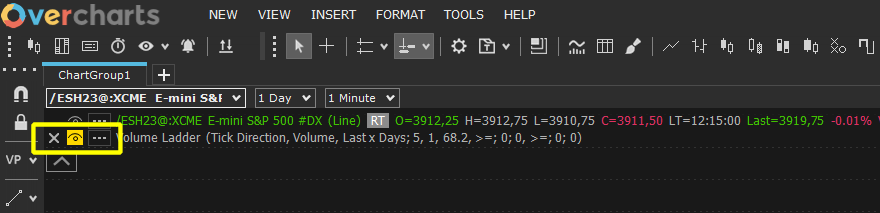
To delete an object, press the corresponding X button on status-line:
Window Main chart CANNOT be deleted.
Show/Hide an object #
To show/hide an object, press the corresponding eye button on status-line:
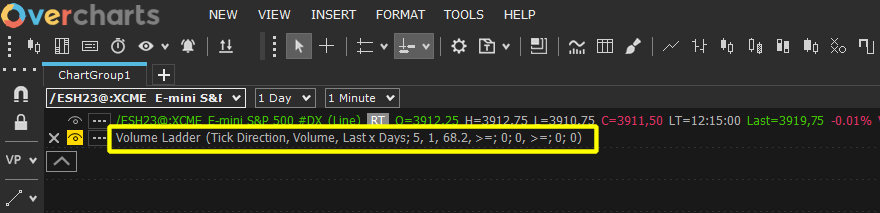
Quickly access object-settings #
To quickly access object-settings, click on object description part highlighted in the image below:
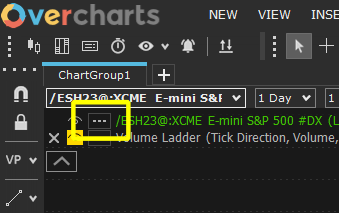
Further commands #
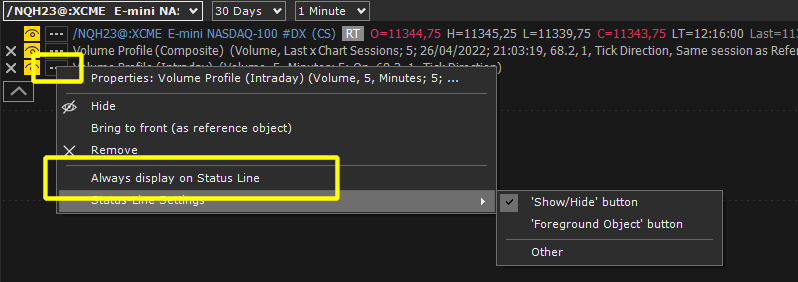
You can access further commands by pressing three-dot button corresponding to the object on status-line:
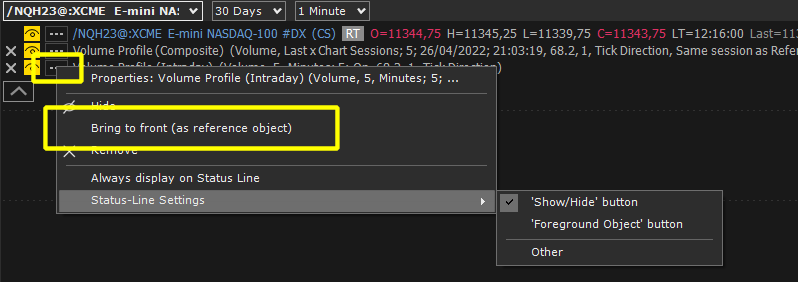
Bring an object to front (as a reference) #
When you draw a trendline or any other drawing-tool, the reference object (drawing-tool owner) will be the foreground object.
Warning! Being the foreground object in this case does NOT mean being the drawn object above all others. Drawings reference chart or indicator may NOT be the object drawn on top of all others.
To set drawings reference-object, select Bring to front (as reference object) menu item highlighted in the image below:
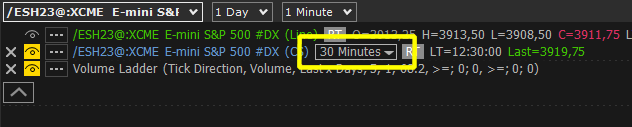
Change sub-chart resolution #
You can quickly change the resolution of a sub-chart using the appropriate combo-box in the status-line:
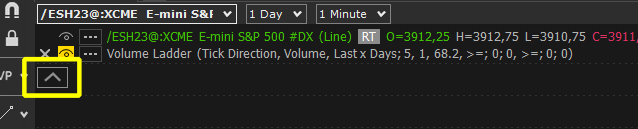
Set an element as Always Visible on status-line #
By default, only main-chart is always visible on status-line. Indicators and sub-charts are present in the status-line but, using the button highlighted in the image below, they can be hidden/displayed at will:
To make an element permanently visible on status-line, select Always display on Status-line menu item highlighted in the image below: