

TPO Profile (Long-Term) allows you to build a TPO Profile with a frequency of x days, weeks, months or years
Click HERE for a general overview of the various types of TPO Profiles available and useful tips
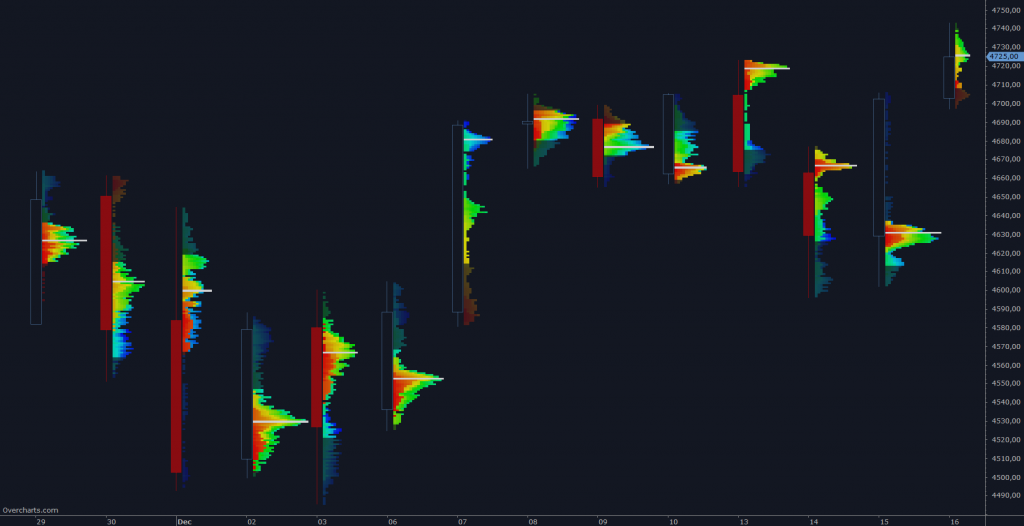
For example, use this indicator to build a TPO Profile for each bar on a daily chart by setting TPO Profile frequency equal to 1-Day:
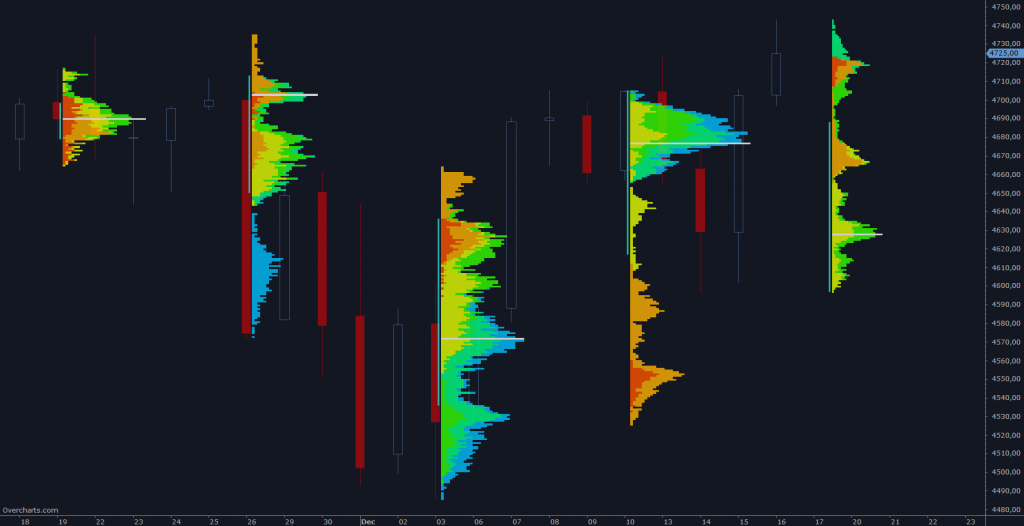
or a weekly TPO Profile on a daily chart:
You have infinite combinations between chart and indicator frequency. The only limitation is that the chart must have a resolution less than or equal to the TPO Profile frequency. To be clear, you CANNOT build a 1-day TPO Profile on a 1-week resolution chart.
Calculation Properties #
You can access calculation properties from the Properties tab in the indicator’s configuration window.
Time-Bracket: Represents the time interval identified by the same letter (typically 30 minutes).
Warning: on a Long-Term TPO Profile, time brackets are NOT drawn using letters, but only boxes.
Time Range: specifies the number of sessions, days, weeks, months, years on which to calculate the indicator. Alternatively, you can specify a start date.
If you are using 1-Tick resolution data to build the indicator, we recommend you not to overdo the time range. Data loading and calculation times progressively increase as the time interval increases. However, there is no recommended maximum time interval. It depends on many factors and in particular on your PC performance, your Internet line and your data feed. Set this property correctly according to your needs and the performance of your PC/data-feed. If you notice very long loading times, decrease the time range.
Build a new one every: defines the construction frequency of TPO Profile. You can build a new TPO Profile every x sessions, days, weeks, months or years by correctly setting the two properties:
- Frequency: frequency type (sessions, days, weeks, months, years). If set as Same as Chart, in case of intraday charts, a TPO Profile will be constructed for each chart session.
- Units: number of sessions, days, weeks, months, years, depending on frequency type
Value Area (%): specifies the Value Area width (as a percentage). Typical value of this property is 68.2 (default). We recommend you do not change it unless you have special needs.
Ticks per Row: specifies the width (in ticks) of each price level. A tick is the smallest price movement (tick size) defined in the instrument configuration. Typically, the correct value for this property is 1. For some instruments, where the tick size is very small compared to the current price (e.g., U.S. stocks), it may be necessary to group several price levels into one by setting this property to a value greater than 1.
Resolution: defines the resolution of data to be used for calculating the indicator:
- 1-Tick: use this resolution for the highest-definition TPO profile. It is not recommended for weekly, monthly, or yearly TPO Profiles due to the large amount of data required for the calculation. Data loading and calculation times can be long.
When resolution is 1-Tick, setting Bid/Ask – Calculation Method allows choosing how volumes of individual ticks are assigned to Bid or Ask:- Tick Direction: Volume is assigned to Bid or Ask based on direction of the current tick compared to the previous one. In other words, if current tick price is higher than the previous one, volume is assigned to Ask; if lower, it is assigned to Bid. If price is the same, volume is assigned to Bid or Ask based on last assignment made.
- Bid/Ask: Volume is assigned to Bid if the seller is the aggressor, or to Ask if the buyer is the aggressor. If the aggressor is unknown and the price is between Bid and Ask, volume is assigned to Bid or Ask depending on the last assignment made.
- 1-Minute: use this resolution for an approximate TPO Profile (recommended for weekly, monthly, and yearly TPO Profiles). Data loading and calculation times are very short
If data resolution is different from 1-Tick, total bar volume is assigned to the price level corresponding to the bar’s close.
In addition to the properties listed here, there are other minor properties or properties that do not require further explanation.
Style Properties #
You can access style properties from the Style tab in the indicator’s configuration window.
NOTE: In addition to style properties listed below, there are other minor or repetitive properties that do not require further explanation.
Style properties listed below repeat for each session type set in Calculation Properties. You can define a completely different style for each session (#1 and #2).
TPO Profile #
Coloring Mode: you have many different coloring types available. Choose TPO-Profile color according to the study or information you want to highlight:
- Heatmap: TPOs are colored with a different shade based on their position within the trading session (Trading Hours)
- Single Color: entire Profile is colored using a single color
- Multiple Colors: TPOs take on a different color according to the Time-Bracket they belong
- UpDown TPO-Profile: Profile is colored according to the Open/Close values of entire Profile
- UpDown Bar-Range: TPOs are colored according to the Open/Close values of Time-Bracket they belong
- Volume TPO-Profile: entire Profile is colored according to the profile total-volume in relation to the other TPO-Profiles displayed
- Volume Price: Profile is colored according to the volume of each single price level (similar to Volume Profile)
- Volume Bar-Range: TPOs are colored according to the volume traded in the Time-Bracket they belong
- Delta TPO-Profile: entire Profile is colored according to the profile delta in relation to the other TPO-Profiles displayed
- Delta Price: Profile is colored based on delta of each single price level compared with delta of the other price levels (similar to Volume Ladder indicator)
- Delta Bar-Range: TPOs are colored according to the delta of Time-Bracket they belong
Direction: specifies TPO-Profile bars direction when drawn in aggregate mode: from Right to Left or Left to Right.
Position: specifies the TPO profile position relative to the time interval on which it is built. You can place the TPO profile at the beginning or end of the range (internally or externally). In case of TPO Profile built on each single bar, an internal position will draw the TPO Profile to the center of bar, an external position will draw the TPO Profile on the right or left side of bar.
Split into Columns: TPO-Profile can be displayed aggregated or divided into columns. A column corresponds to:
- 1 Time-Bracket > if calculation frequency is Session or Day
- 1 Session > if calculation frequency is Week
- 1 Week > if calculation frequency is Month
- 1 Month > if calculation frequency is Year
Particularly useful when time period represented by a column and the resolution of underlying chart coincide.
Width: specifies the width of each TPO profile in percentage or pixels. If using a percentage, the TPO profile width will be a percentage of the reference area.
Value Area:
- Style: You can draw the Value Area in 2 different ways:
- Internal: Value Area is drawn inside TPO Profile making it more visible than the rest of TPO Profile. Set Outside Opacity property to make the part of TPO Profile NOT belonging to the Value Area LESS visible.
- Vertical Line: Value Area is represented by a vertical line drawn next to TPO Profile.
Highlight period open price: specifies whether to highlight, with a color of your choice, the first box of each:
- Time-Bracket > if calculation frequency is Session or Day
- Session > if calculation frequency is Week
- Week > if calculation frequency is Month
- Month > if calculation frequency is Year
Current TPO Profile (LAST):
You can set a completely different position and style for current TPO Profile (last) compared to historical TPO Profiles
LAST – Position: specifies whether to draw the last TPO profile inside the chart or on the chart’s right margin. If drawn on the right margin, you can align the TPO profile to the right, center, or left of the margin.
POC (Point of Control) #
POC is the price level with the greatest TPOs number, around which the value area is calculated. Use properties available in this section to draw or not the POC and set it according to your needs.
Naked Line: is a horizontal line drawn from POC and extended to the end of chart (right side). The line is drawn ONLY if the price level has not yet been reached by current prices, or rather, by subsequent TPO Profiles.
Single Prints #
A single print consists of one or more consecutive price levels containing only 1 TPOs. All TPOs involved must belong to the same Time-Bracket and therefore be represented by the same letter.
A Single Print in UP trend is formed when:
- one or more consecutive price levels appear containing a single TPOs represented by a single letter
- consecutive price levels always correspond to new TPO-Profile highs
- Single Print confirmation occurs only when the first TPOs belonging to the next Time-Bracket (next letter) appears, and ONLY if this TPOs belongs to a price level higher than the first price level where the Single Print was detected
A Single Print in DOWN trend is formed when:
- one or more consecutive price levels appear containing a single TPOs represented by a single letter
- consecutive price levels always correspond to new TPO-Profile lows
- Single Print confirmation occurs only when the first TPOs belonging to the next Time-Bracket (next letter) appears, and ONLY if this TPOs belongs to a price level lower than the first price level where the Single Print was detected
ONLY Single Prints NOT yet reached by current prices are drawn on chart
A Single Print CANNOT belong to the first or last Time-Bracket of the session
A Single Print is NEVER found at the ends of TPO-Profile, but always in the middle
The greater the number of consecutive price levels involved, the greater the importance of Single Print
Open Gap/Lap #
An Open Gap/Lap represents a Last price level (last price of a previous TPO Profile) not yet reached by current prices, or rather, by subsequent TPO Profiles. It is represented by a horizontal line drawn from the previous Last price and extended to the end of the chart (right side).
Labels/Markers/Level Lines #
You can highlight significant price levels such as Open, High, Low, Last, Middle, POC, Value Area (high/low), Half Gap/Lap, etc. using labels and/or horizontal lines. Configure which levels to display according to your needs using the properties available in this section.
Summary #
You can display summary values at the bottom of each TPO profile, such as Total Volume, Total Delta, High/Low Range, and Initial Balance, and the number of TPOs. Configure which summary values to show according to your needs using the properties available in this section.


