

Each chart or indicator has its own price/value scale that can be displayed on the right and/or left side of the window/column.
Y-axis specific properties of a chart/indicator can be found in the Y-Axis Tab of its configuration:
Scaling Type: Linear / Semi-Logarithmic
Scaling Range: Screen / Entire Series / User Defined / Same as Reference Object
Top Margin (%): Defines (in percent) the distance between the chart/indicator upper side and the window top in which it is contained. It is considered ONLY if Scaling Range is set to Screen or Entire Series.
Botton Margin (%): Defines (in percent) the distance between the chart/indicator lower side and the window bottom in which it is contained. It is considered ONLY if Scaling Range is set to Screen or Entire Series.
Scaling Format: Defines the format and number of decimal places of prices/values displayed on scale.
You can show/hide the left/right scale of each single column in the window, in one of the following ways:
- Right Click on Y-axis > View > Left Scale / Right Scale
- Right Click on Y-axis > Properties: Y-Axis (General) > Right Scale / Left Scale > Display
If there are several charts and indicators in the same inner window, you can choose which scale to display. You can also choose a left scale other than the right scale. In other words, if in the same inner window there are for example a chart and an RSI indicator, you can display chart price scale on the right and RSI values on the left (or vice versa):
- Right Click on Y-axis > Select the chart or indicator whose scale you want to view (among the menu items at the bottom)
Scaling Types #
2 scaling types available:
Linear: (default) is the most commonly used scale in charts. In this scale type, the same distance is attributed to equal absolute changes in prices. In other words, if the price of an instrument goes from 10 to 20 dollars or from 1000 to 1010 dollars, the size of two increments (always equal to 10 dollars) will be represented in the same way in the scale.
Semi-Logarithmic: is a percentage-based scale. A 10% change in price will always be represented by the same vertical displacement on Y-axis, regardless of the absolute change in price.
This scale type CANNOT be used if there are values less than or equal to zero in the chart/indicator data series. In this case, the scale will always be linear, whatever the set value.
This scale type does NOT affect stand-alone indicators, i.e. indicators such as RSI, MACD or in general all indicators that DO NOT share the scale with their Reference Object (chart or indicator). In this case the scale will always be linear, whatever the set value.
Scaling Range #
4 scaling ranges available:
- Screen: scale is auto-setting based on prices/values present in the range (X-axis) visible on chart.
- Entire Series: scale is auto-setting based on prices/values present in the entire range (X-axis) of chart (including any part of the X-axis not visible on screen).
- User Defined: scale range is manually defined by user.
- Same as Reference Object: settable only from chart/indicator configuration window. This scale type should be used when the scale of an indicator/sub-chart coincides with its reference-object scale. A typical example is the moving average indicator whose scale always coincides with the scale of its reference chart.
Manually Scale Changing #
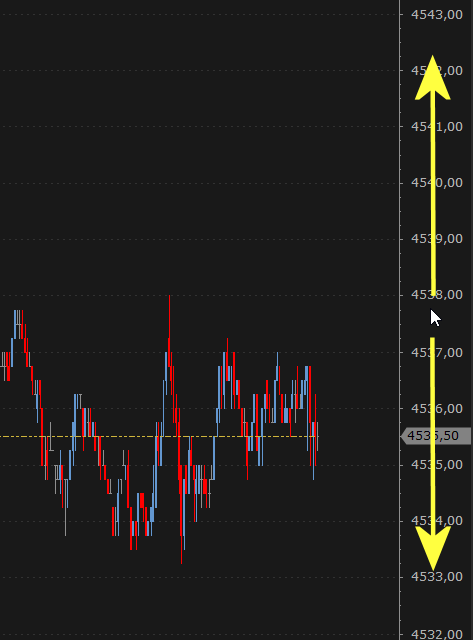
To compress or decompress the Y axis:
- left click on Y-axis top or bottom area and move the mouse up or down (you can also use the mouse wheel directly on Y-axis top or bottom area). Scaling Range will be automatically set to User Defined:
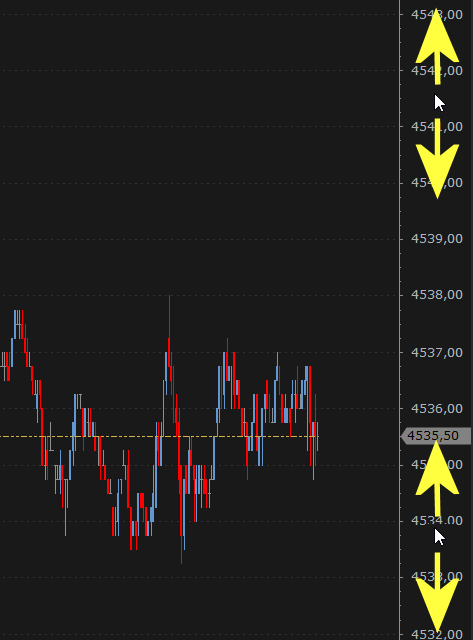
To move Y-axis vertically while keeping the scale range unchanged:
- left click on Y-axis central area and move the mouse up or down (you can also use the mouse wheel directly on Y-axis central area). Scaling Range will be automatically set to User Defined:
- or, if Scaling Range is set to Screen or Entire Series, set Scaling Range = User Defined to start manual scaling, then drag the window background to the new location.
Manual Zoom #
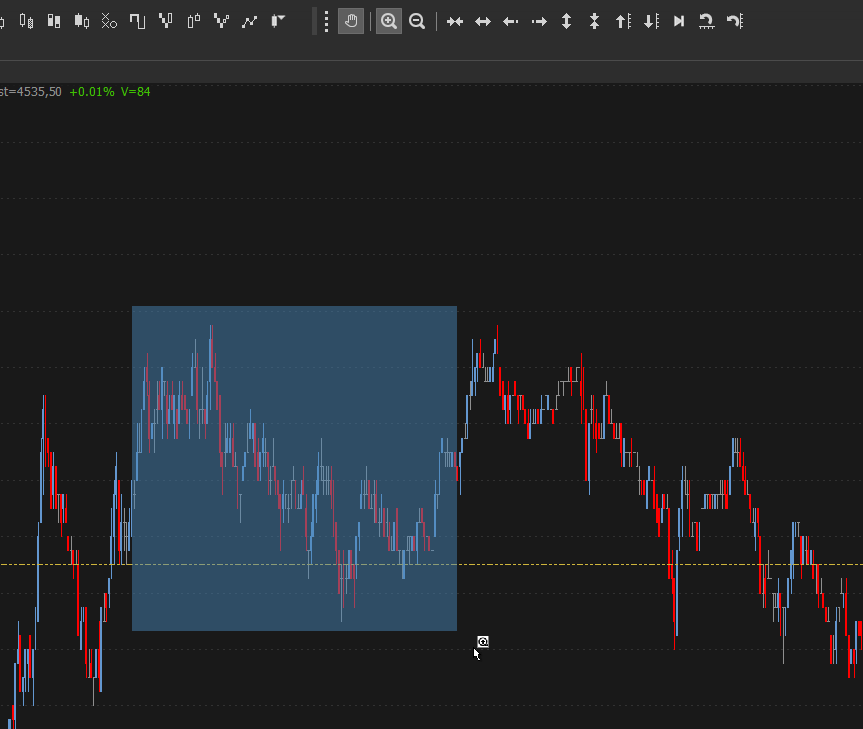
Manual zoom allows you to zoom-in on a specific chart area by defining the area directly on chart using the mouse:
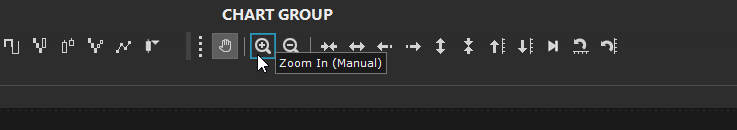
1. Activate manual zoom by pressing Zoom-In (Manual) button on Zoom and Control toolbar
2. Draw the area on chart using the mouse:
3. Disable manual zoom by pressing Zoom-In (Manual) button again on Zoom and Control toolbar
To undo the zoom, press Zoom-Out (Manual) button on Zoom and Control toolbar or ‘SHIFT –‘ hotkey
Lock Y-Axis #
You can lock/unlock Y-axis, in one of the following ways:
- Right Click on Y-Axis > Lock Y-Axis
- Right Click on Y-Axis > Properties: Y-Axis (General) > Lock Y-Axis
Y-axis lock only takes effect when Scaling Range is set to Screen or Entire Series. When lock is active, by dragging window background, chart is NOT free to move in any direction but only horizontally. Y-axis scale will automatically set with values visible on screen (if Scaling Range = Screen) or of the entire series (if Scaling Range = Entire Series).
By unlocking Y-axis, chart will be free to move in any direction (by dragging window background). As a consequence, first time the background is moved, Scaling Range will be automatically set to User Defined.
On real-time data receiving:
- If lock is active (RECOMMENDED), Y-axis will keep the last price visible regardless of Scaling Range set.
- If lock is NOT active and Scaling Range = User Defined, last price will NOT be automatically kept visible within the Y-axis. In other words, you will need to manually move the chart from time to time in order to maintain visible the last price.
Center Last Price on Scale #
You can choose to keep or not the last price of a CHART always at the center of the Y-axis. This feature can be particularly useful, for example, if some Advanced Columns are present in the chart window.
To keep (or not) the last price always at the center of the Y-axis:
- Right Click on Y-axis > Center Last Price on Scale
- in the chart configuration > Style Tab > Center Last Price on Scale
Reset Y-Axis #
Resetting the Y-axis consists of setting the Scaling Range = Screen.
To reset scales of all charts/indicators in all inner windows of the same column:
- Right Click on Y-axis > Reset All Scales
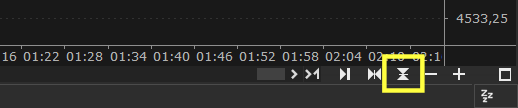
- or press Reset Price Scales button on horizontal scroll bar:
To reset ONLY scales of all charts/indicators in a specific inner window:
- Right Click on inner window Y-axis > Reset All Scales (this window)
Further General Properties #
Other general and style properties are available in the configuration window: Right Click on Y-Axis > Properties: Y-Axis (General).
Here are the most relevant:
Width Calculation: specifies whether to calculate the scale width automatically or manually. In the case of manual calculation you will need to manually set the width (expressed in number of characters).
Show Last Value Markers (on Y-axis): if checked, latest prices/values of charts and indicators will be shown on Y-axis (unless otherwise specified in the chart/indicator configuration).
In configuration window > Style Tab, you can also set colors, fonts and whether or not to display the grid horizontal lines.


