

Explore Data window allows the viewing and “modification” of the data contained in the instrument’s local database.
Remember that data management in Overcharts is completely automatic. Use this window ONLY to view database data and NOT to modify the data manually (unless necessary). Manual data modification, in fact, could be overwritten by a subsequent automatic data download.
Access Explore–Data window #
You can access Explore-Data window in one of the following ways:
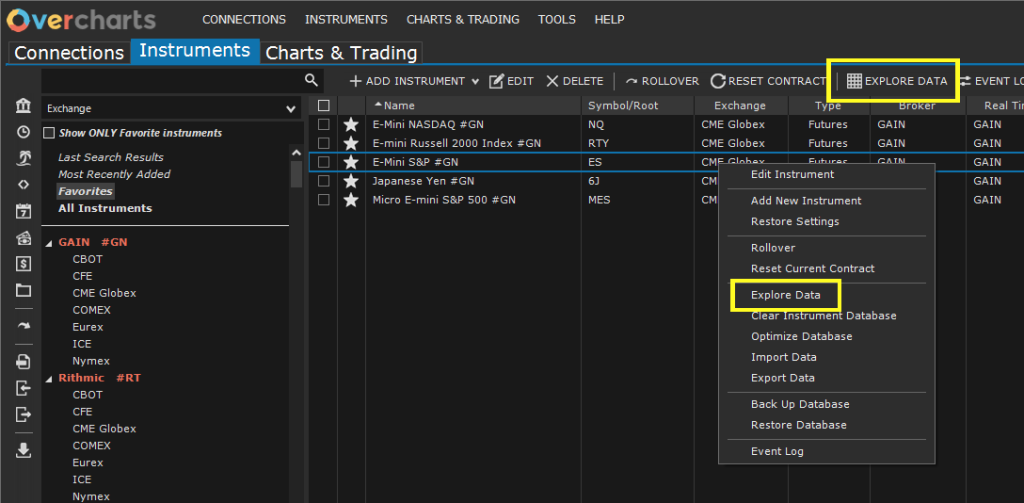
- From the Overcharts main window > Instruments Tab > select the instrument > press Explore Data button
- or from the Overcharts main window > Instruments Tab > select the instrument > right-click > Explore Data
Explore the data #
To explore the data contained in an instrument’s local database, follow these steps:
- Access Explore-Data window.
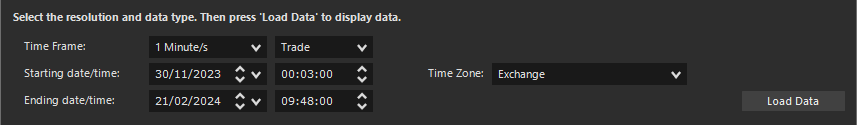
- Select the Time Frame to display (1-Tick, 1-Minute, 1-Day).
- Select the data type (Trade, Bid, Ask). Generally the data type to select is always Trade which corresponds to the price flow.
- Select the date range to view. The range is automatically set based on the data in the database for the selected time frame.
- (optional) Select the time zone for data display. We recommend you keep default setting (Exchange).
- Press Load Data button to view the data corresponding to the settings defined in the previous steps.
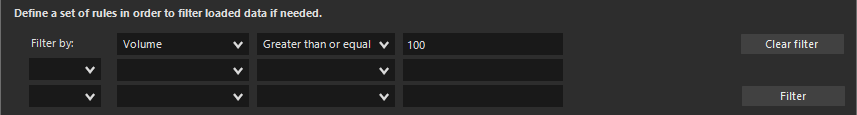
You can define up to 3 conditions to further filter the data to display. Set one or more conditions joined by And/Or and press Filter to filter the data:
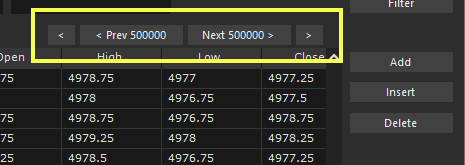
The data is loaded at intervals of 500000. If set date range contains more than 500000 records, scroll the data using scroll buttons above the data grid:
Data is displayed in the grid based on selected time frame and filters. Displayed columns depend on selected time frame. Below are the available columns:
- Date: bar date.
- Time: (only for time frames less than 1-Day) bar time.
- Open: (only for time frames greater than 1-Tick) bar open price.
- High: (only for time frames greater than 1-Tick) bar high price.
- Low: (only for time frames greater than 1-Tick) bar low price.
- Close: bar close price.
- Open Interest: (usually only present in 1-Day data) bar open-interest.
- Volume: bar total volume.
- Up Volume: (only for time frames greater than 1-Tick) sum of tick volumes (trades) whose price is greater than the price of previous tick.
- Down Volume: (only for time frames greater than 1-Tick) sum of tick volumes (trades) whose price is lower than the price of previous tick.
- Unchanged Volume: (only for time frames greater than 1-Tick) sum of tick volumes (trades) whose price is equalt to the price of previous tick.
- Total Tick: (only for time frames greater than 1-Tick) bar total ticks.
- Up Tick: (only for time frames greater than 1-Tick) number of ticks whose price is greater than the price of previous tick.
- Down Tick: (only for time frames greater than 1-Tick) number of ticks whose price is lower than the price of previous tick.
- Unchanged Tick: (only for time frames greater than 1-Tick) number of ticks whose price is equal to the price of previous tick.
- Filled at: (1-Tick time frame only) indicates where the trade was filled, i.e. whether it was filled at ASK, Above-ASK, at BID, Below-Bid or between BID and ASK.
Edit the data manually #
Remember that data management in Overcharts is completely automatic. Use this window ONLY to view database data and NOT to modify the data manually (unless necessary). Manual data modification, in fact, could be overwritten by a subsequent automatic data download.
Add a new record #
To add a new record, follow these steps:
- Select the time frame where you want to add the record and press Load Data.
- Press Add button to add a record to the end of loaded range, or press Insert to add a record at the position you are in the grid.
- Set all fields in the grid.
- Press OK to confirm the changes. If you need to add more records, we recommend doing so before pressing OK button. By pressing OK, changes will be saved to the database and Explore-Data window will close.
Edit a record #
To edit a record, follow these steps:
- Select the time frame where you want to add the record and press Load Data.
- Find the record in the grid (based on its date/time).
- Edit the record according to your needs.
- Press OK to confirm the changes. If you need to edit more records, we recommend doing so before pressing OK button. By pressing OK, changes will be saved to the database and Explore-Data window will close.
Delete a record #
To delete a record, follow these steps:
- Select the time frame where you want to add the record and press Load Data.
- Find the record in the grid (based on its date/time).
- Select the record in the grid using the apposite check-box and press Delete button.
- The record will be marked as ‘to be deleted’ by slightly changing color.
- Press OK to confirm the deletion. If you need to delete multiple records, we recommend you do so before pressing OK button. By pressing OK, selected records will be deleted and Explore-Data window will close.
Adjust Prices #
To adjust prices by adding / subtracting an offset, follow these steps:
- Select the time frame where you want to add the record and press Load Data.
- Press Adjust Prices button.
- In the window that opens, set the price adjustment mode and the offset (adjustment value):
- adjustment by Difference: the adjustment value is added (if positive) or subtracted (if negative) to the price.
- adjustment by Ratio: the price is multiplied by adjustment value.
- Press OK in the price adjustment window to apply the adjustment to the records in the grid.
- Press OK in Explore-Data window to permanently commit the changes.


