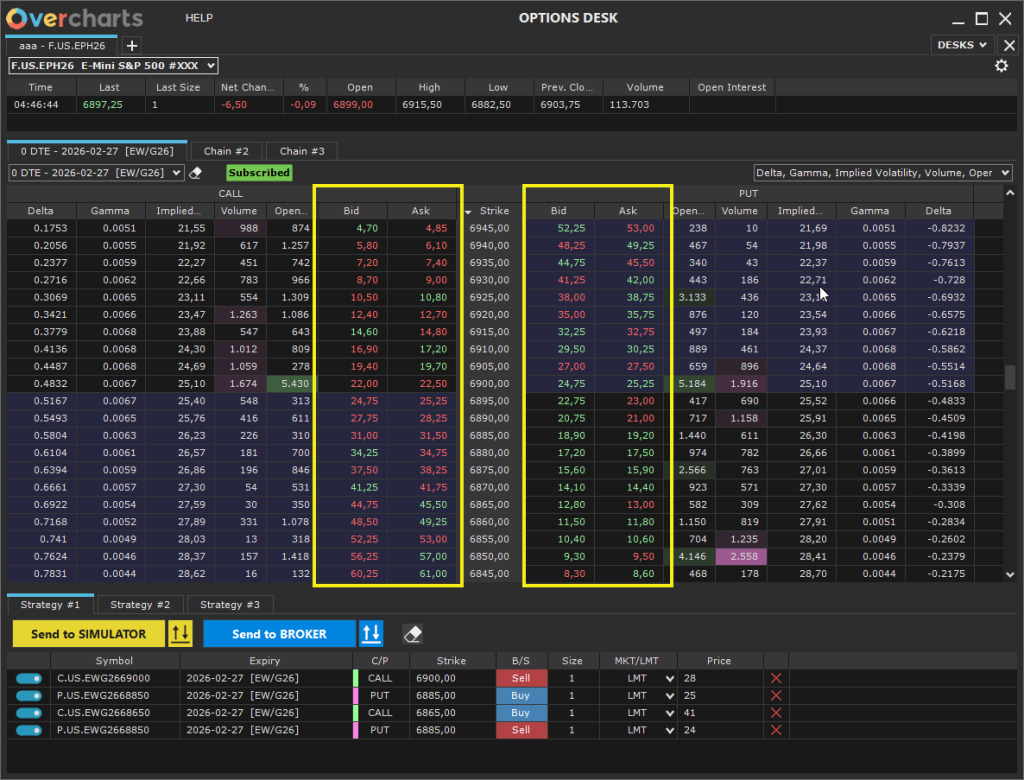
The Options Desk function allows you to view the Option Chains of various instruments. This window enables you to quickly monitor prices, volumes, Greeks, and other key information for both the underlying asset and its related options.
You can access the Options Desk window in one of the following ways:
- From the Overcharts main window > Tools menu > Options Desk
- Or from the Workspace window (regular or simulator!) > Tools menu > Options Desk
WARNING!
The Options Desk function is available only for the CQG data-feed.
Options trading available starting May 2026.
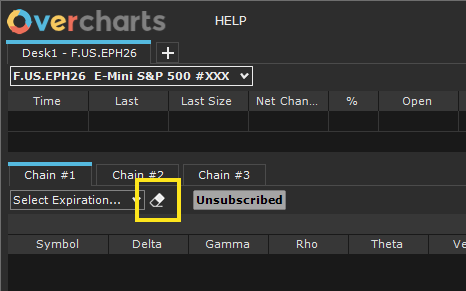
Desk #
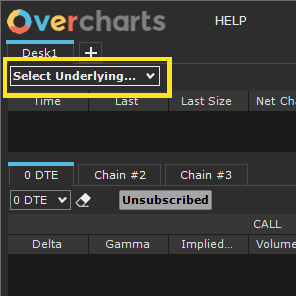
In the Options Desk window, you can create multiple desks, each dedicated to a single underlying. The underlying is selected using the combo-box located at the top left of the window.
Desks are organized in Tabs, allowing you to quickly switch between underlyings and compare different instruments simultaneously. Each desk operates independently and retains its own display settings and option chain expirations.
Add a New Desk #
To add a new desk:
1. Click the “+” button on the Desk tabs
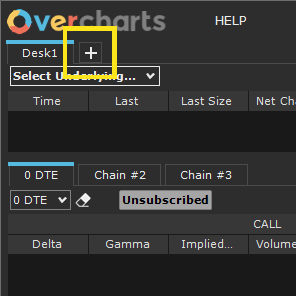
or select Desk > New from the menu
2. Select the underlying from the combo-box at the top left
Once the new desk is created, a corresponding tab is automatically added alongside the existing ones. You can reposition the desk tab as desired by dragging it left or right.
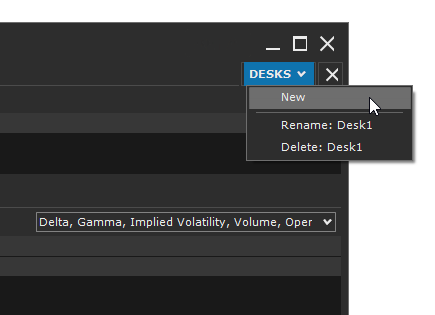
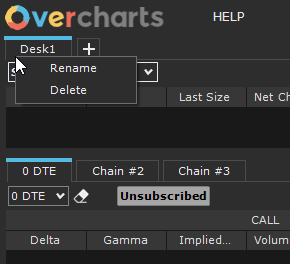
Rename or Delete a Desk #
You can rename or delete a desk in one of the following ways:
From the Desk menu > Rename / Delete
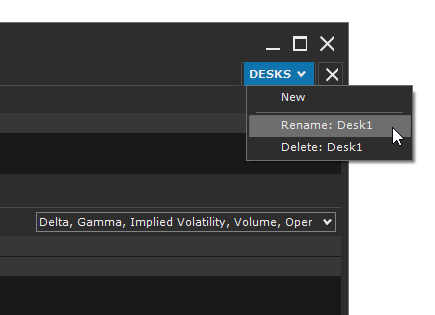
Or by right-clicking the desk tab > Rename / Delete
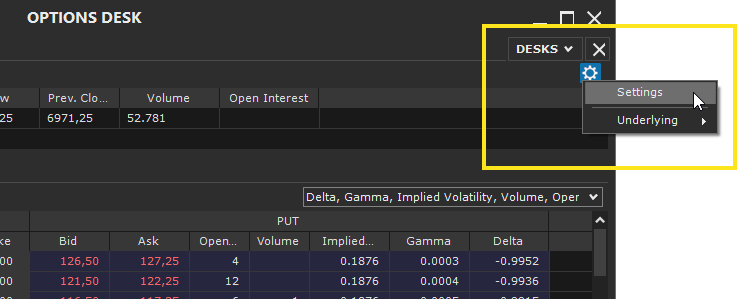
Settings #
To access the settings, click the gear icon at the top right of the Desk window and select Settings.
Available Properties
Option Chain #
‘General‘ section
- Interest Rate (%): the risk-free rate reflecting the return of a safe investment (e.g., government bonds), used to calculate the present value of an option, for example via the Black-Scholes model.
- IV Calculation Price (Implied Volatility): the option price used to calculate implied volatility (IV), Greeks, etc. (Possible values: Last, Bid, Ask, (Bid + Ask)/2).
‘Chain‘ section
- Max Number of Strikes to Show: This property defines the maximum number of strikes that will be shown in the Option Chain for the selected expiration. The configured value determines the range of the displayed chain, including strikes closest to the underlying price.
The actual number of displayed strikes is limited by the data-feed connection parameters (Overcharts main window > Connections Tab). If the data-feed allows subscription to fewer strikes, the chain will show at most those permitted by the connection, even if the configured value is higher. Please read this WARNING carefully. - In-The-Money Background Color: Specifies the background color for Call options with strikes below the current underlying price and for Put options with strikes above the current underlying price.
- Highlight High Volume: (for the Volume column only) If selected, highlights cells with high volume using a specific color. The higher the volume, the more intense the color.
- Highlight High Open Interest: (for the Open Interest column only) If selected, highlights cells with high open interest using a specific color. The higher the value, the more intense the color.
‘Style‘ section
- Text Size: defines the font size to use.
Strategy #
‘Defaults‘ section
- Order Type: Specifies the default order type that will be initially used when inserting orders during strategy creation. Two types are available:
- MKT: Market order
- LMT: Limit order
‘Style‘ section
- Color ‘CALL’: Specifies the color to use in the strategy grid to quickly identify a CALL option.
- Color ‘PUT’: Specifies the color to use in the strategy grid to quickly identify a PUT option.
Underlying #
At the top of the window, the current information for the underlying is displayed, including:
- Current Price (Last Price)
- Current Size (Last Size)
- Open, High, Low, Close, and Daily Volume
- Open Interest (if available)
- Other relevant market data, such as percentage changes
This information allows you to keep the underlying instrument under constant observation, providing immediate context for analyzing its related options.
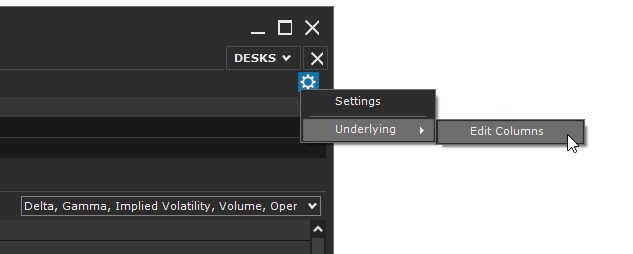
To customize the columns:
Right-click on the underlying grid > Edit Columns
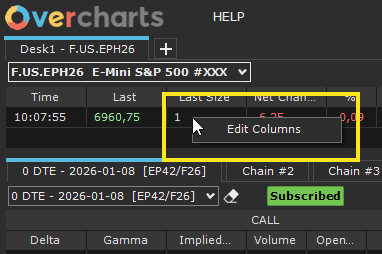
or
- go to Settings (gear icon at the top right)
- select Underlying > Edit Columns
Option Chain #
An Option Chain is an organized table that shows all the option contracts available for a given underlying, grouped by strike price and expiration.
Each row represents a specific strike and includes information on the corresponding Call and Put options, such as bid/ask prices, last price, volume, open interest, and other relevant metrics (Greeks).
Option Chains allow you to:
- Quickly compare option prices across different strikes and expirations
- Analyze liquidity and volume of derivative instruments
- Support trading decisions and complex option strategies
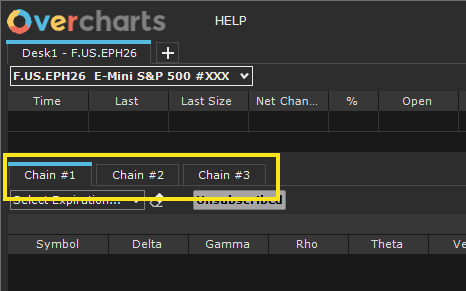
Each desk contains 3 Tabs, each dedicated to a separate Option Chain. For each tab, you can select a different option expiration, allowing comparison across different maturities:
To set the expiration, use the combo-box at the top left of the Chain tab:
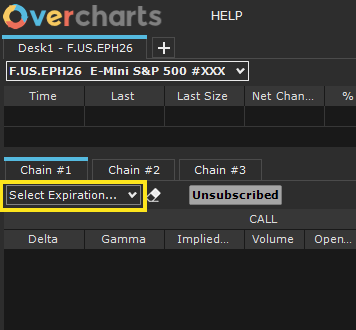
Then select the desired expiration:
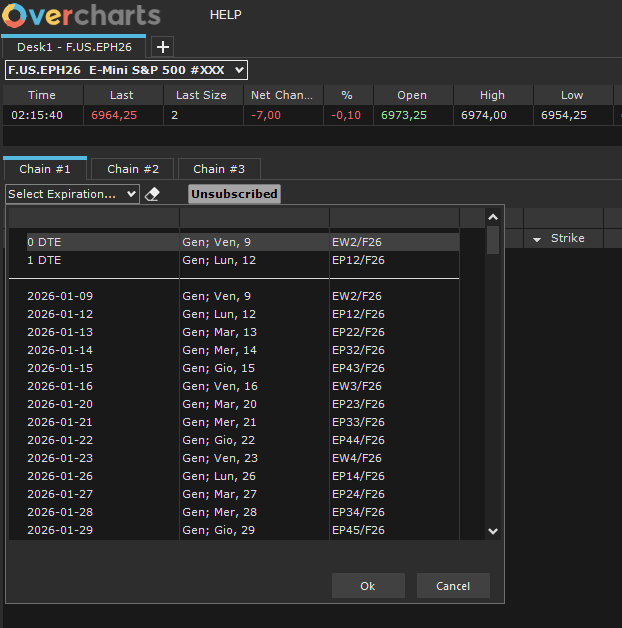
Once the expiration is selected, the Chain will load gradually, subscribing to the data of all involved options:

WARNING!
The Option Chain is available only for instruments that have options. If the underlying does not have derivative contracts, the Chain will not be displayed.
To clear (reset) the expiration, click the button next to the combo-box:
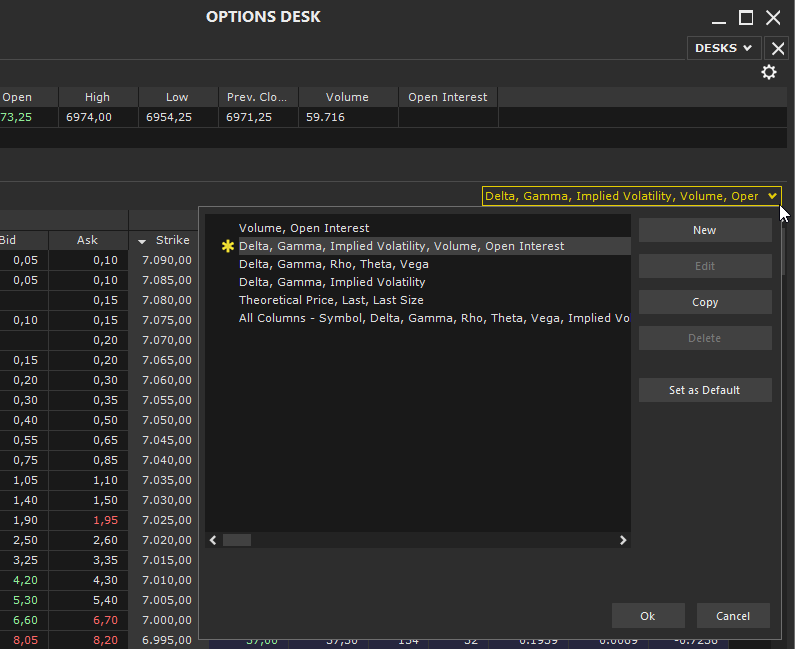
Chain Columns #
Set the visible columns in the Chain using the combo-box at the top right of the grid:
- You can select a predefined configuration or create a new one.
- Not all columns can be deselected: some are always present, such as Strike, Bid Price, and Ask Price.
- By selecting a configuration from the list and clicking the ‘Set as Default‘ button, you can define a default configuration that will automatically apply to all new chains created afterwards.
Available Columns
- Symbol: uniquely identifies the specific option.
- Delta: measures the sensitivity of the option price to a one-unit change in the underlying price.
- Gamma: indicates the change in Delta as the underlying price changes, measuring the curvature of the option price relationship.
- Rho: represents the sensitivity of the option price to changes in interest rates.
- Theta: measures the change in the option price with the passage of time (time decay).
- Vega: indicates the sensitivity of the option price to changes in the underlying’s implied volatility.
- Implied Volatility (IV): the volatility expected by the market, implied in the option price and calculated using the Black & Scholes model.
- Open Interest: represents the total number of open contracts for that specific option that have not yet been closed or offset.
- Last, Last Size: Last indicates the price of the last executed trade, while Last Size shows the number of contracts traded in that last trade.
- Theoretical Price: the estimated value of the option calculated using the Black & Scholes model.
- Bid, Bid Size: Bid indicates the best available purchase price, while Bid Size is the number of contracts offered at that price.
- Ask, Ask Size: Ask indicates the best available selling price, while Ask Size is the number of contracts requested at that price.
- Strike: the option’s exercise price.
Strike Subscription Limit #
The maximum number of subscribable strikes is determined by the “Maximum Number of Strikes to Subscribe” parameter in the data-feed connection settings (Connections Tab in the Overcharts main window).
This means that if the connection has a maximum limit of 50 strikes, even if you configure the chain to display 200 strikes, the number actually displayed cannot exceed 50.
It is also recommended not to exceed the number of subscribed strikes, as this directly impacts real-time performance. For example, subscribing to 50 strikes actually subscribes to 100 distinct instruments (50 Calls and 50 Puts), corresponding to 100 separate real-time streams.
To achieve the best balance between information completeness and performance, it is recommended to configure the number of strikes (in the data-feed connection settings) in accordance with your operational needs, PC performance, Internet connection, and the data-feed capabilities.
Notes on Greeks and Implied Volatility Calculation #
The calculation of Greeks, implied volatility, and theoretical price is performed using Black & Scholes formulas.
Due to the flexibility in using these models and the different parameters involved (such as interest rates, dividends, historical volatility, and price rounding), calculated values may differ significantly from those displayed on other platforms. Each platform uses different methods and parameters, so values are not directly comparable. What matters most is the order of magnitude of the results.
Note: For American options or options with special features, values calculated with Black & Scholes are approximate and may differ further compared to other platforms that use more complex models.
Real-Time Data Update #
To reduce the impact on PC performance, set the ‘Data Refresh Rate‘ property appropriately in Preferences > Option Chain (accessible from Overcharts main window > Tools menu > Preferences).
The Data Refresh Rate property allows you to set how often Option Chain data is refreshed. Increasing this value reduces the number of real-time updates, helping minimize the impact on PC performance.
Therefore, if you notice slowdowns in the real-time feed or overall PC performance, it is recommended to increase the refresh interval, thereby reducing the update frequency.
Trading #
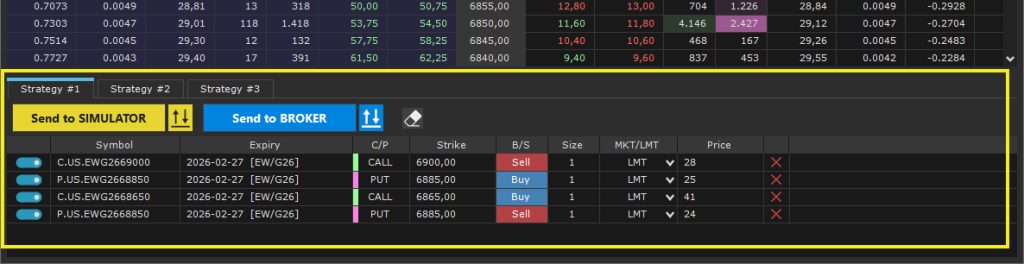
Strategy Creation #
The Strategy Creation feature allows you to build an options strategy by combining multiple Call and Put orders directly from the Option Chain.
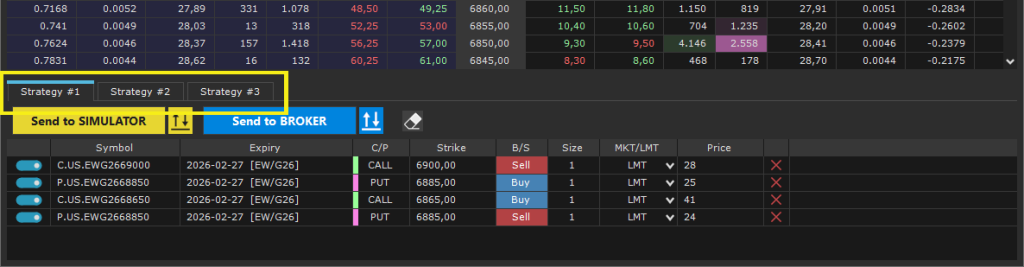
- You can create up to three strategies simultaneously, each managed in a separate grid.
- Each grid operates independently, allowing you to build different strategies at the same time.
Order Entry #
In the Option Chain, click on the Bid or Ask columns of the desired Call or Put to insert the corresponding row into the selected strategy grid.
Alternatively, you can use the Option Chain pop-up menu:
- Right-click on a row in the Chain > select: Buy CALL, Sell CALL, Buy PUT, Sell PUT.
You can add as many order rows as needed to build the desired strategy.
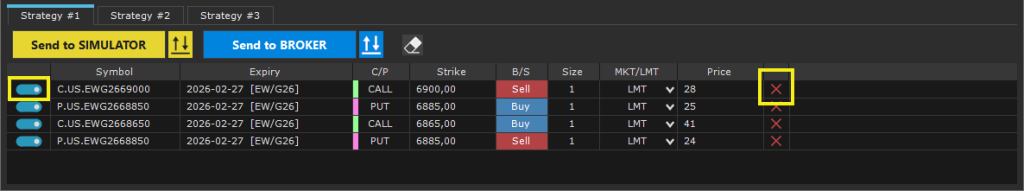
Modifying Orders #
Each order row can be deselected or removed individually:
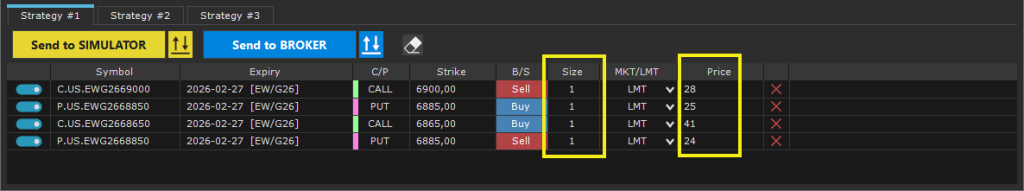
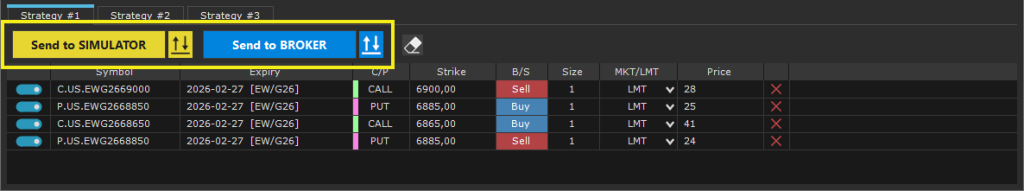
You can specify the quantity and price (for Limit – LMT orders).
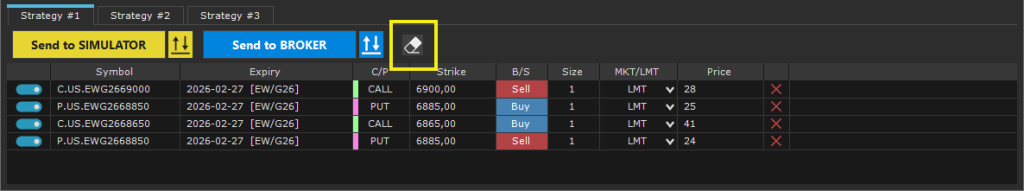
The entire strategy can be cleared completely using the “Clear Grid” button, which removes all order rows present in the grid.
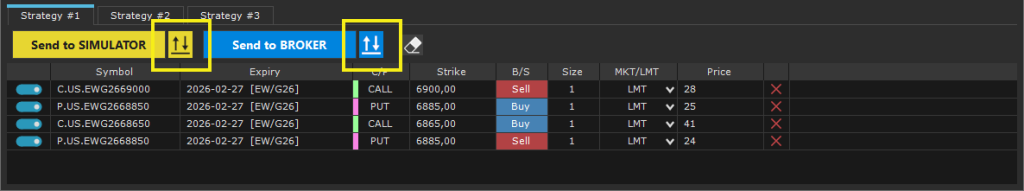
Sending the Strategy #
Once the strategy is complete, it can be sent to the Simulator or the Broker:
1. Click the “Send to Simulator” or “Send to Broker” button in the Strategy section.
2. A summary window will open where you can:
- Select the account to send the orders from.
- Choose the TIF (Time In Force).
- View the summary of the orders to be sent.
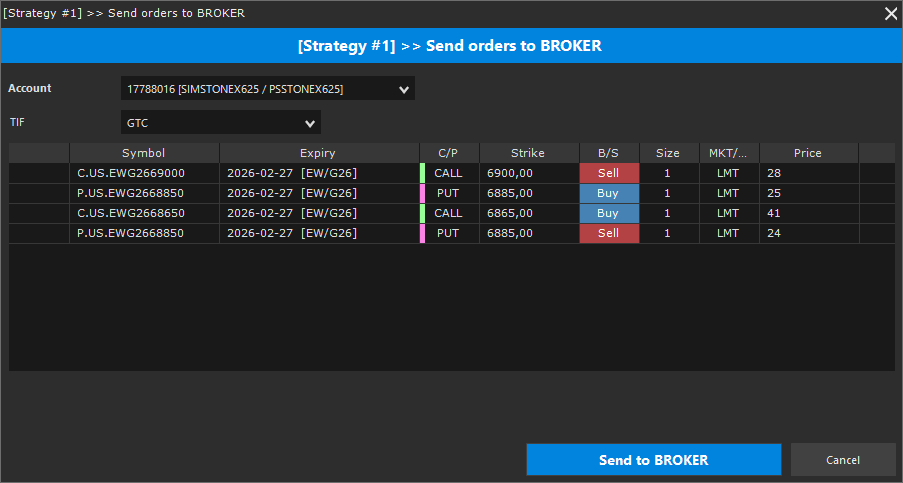
3. Click the “Send to Simulator” or “Send to Broker” button in the summary window to send all orders in the strategy as a single batch.
Order Monitoring and Management #
Once orders have been sent, you can monitor, modify, or cancel them from the “Positions, Orders & Accounts” window, where you can also check the various positions and linked accounts.
- There are two separate windows:
- One for orders sent to the Simulator.
- One for orders sent to the Broker.
- Open the desired window by clicking the corresponding button in the Strategy section.