

IMPORTANT!
At the moment, this indicator works only with the CQG data feed. Additional data feeds will be added soon.
The GEX Profile is an indicator derived from the options market that represents the Net Gamma Exposure calculated for each strike, obtained as the difference between the Gamma exposure of the call and the put associated with that strike.
The indicator produces a series of levels, one for each strike, which reflect the market makers’ net Gamma exposure and can be used as option-derived support and resistance levels.
Basic Logic #
Market makers manage Gamma risk through dynamic hedging on the underlying asset.
The sign and magnitude of the Net GEX determine the prevailing type of hedging when the price approaches a strike.
For each strike:
- Net GEX > 0 → call Gamma dominates, associated with stabilizing hedging and containment of price movements;
- Net GEX < 0 → put Gamma dominates, associated with pro-cyclical hedging and potential price acceleration.
In practice, the options most commonly used to build the GEX Profile are 0DTE options (zero-days-to-expiration), because their Gamma is very high and the net exposure changes rapidly, providing precise signals on relevant operational levels.
Since strikes represent structural and widely observed price levels, areas with significant Net GEX tend to act as operational support or resistance levels, especially near high Open Interest (+ Volume) or expiration.
Formula #
Net GEX(K) = (Gamma call × Open Interest (+Volume) call − Gamma put × Open Interest(+Volume) put
Where:
- Gamma call/put: Gamma of the call or put option at strike K
- Open Interest (+Volume) call/put: Open Interest (optionally including Volume) of the call or put at strike K
and in monetary terms (monetary impact of Gamma exposure on the underlying):
Net GEX monetary(K) = Net GEX(K) × Contract Multiplier × Underlying Price² × 0.01
Where:
- 0.01: scaling factor to make monetary values readable
Both the absolute Net GEX and the monetary Net GEX are used to identify GEX-derived support and resistance levels. The monetary Net GEX expresses exposure in real value terms, while the absolute Net GEX maintains the natural scale of Gamma.
Calculation Properties #
You can access calculation properties from the Properties tab in the indicator configuration window.
Data Source: two options are available:
Data-Feed: data is automatically acquired from your data-feed.
- Interest Rate (%): the risk-free rate reflecting the return of a safe investment (e.g., government bonds), used to calculate the present value of an option, for example via the Black-Scholes model.
- IV Calculation Price: the option price used to calculate implied volatility (IV), Greeks, etc. (Possible values: Last, Bid, Ask, (Bid + Ask)/2).
- Enable Real-Time Update: if selected, the GEX is updated using real-time options data. This requires subscribing to all call and put options for all strikes in the chain. For example, if the chain includes 50 strikes, 100 instruments will be subscribed (50 calls and 50 puts). Due to the large number of monitored instruments, enabling real-time updates can significantly affect PC performance.
If NOT selected, after refreshing the chart, data continues to update automatically for the first 5 minutes. This allows the system to complete the retrieval of all necessary information. After the first 5 minutes, a new chart refresh is required to obtain updated data.
csv/txt file: data comes from a text file (CSV or TXT) that is downloaded and updated manually (for example, from the CBOE website). The file must contain all the information necessary to calculate the GEX: Gamma, Open Interest, Volume, Strike, Option Expiration.
- Full File Path: the full path (Folder \ File Name) of the text file.
- File Format: defines the structure of the CSV or TXT file, including separators, columns, and all information required for proper reading.
- Price Offset (in points): (To be set ONLY if the data refers to index options and the indicator is displayed on the futures) Value to add to the strike to align the index price with the futures price. Remember to update it daily, calculating it as the difference between the futures close and the index close.
- Contract Size: quantity of the underlying represented by each contract. The underlying is the reference instrument for the data contained in the CSV file. If the data in the CSV file refers to SPX options, the SPX contract size (which is 100) must be entered. This value is used to determine the monetary value of the GEX.
- Update Every X… Minutes: specifies the data refresh interval. Updates are performed by periodically rereading the text file.
Options Expiration: specifies the expiration of options to be used in the calculation. Usually, for this indicator, 0-DTE options (options expiring on the current day) are used.
Style Properties #
You can access style properties from the Style tab in the indicator configuration window.
WARNING: In addition to the properties listed here, there are many other properties that are minor or do not require further explanation..
Position: Specifies the position of the GEX Profile on the chart.
Width: Specifies the width of the GEX Profile in percentage or pixels. If set as a percentage, the width will be a percentage of the chart width.
Max Number of Strikes to Show: This property defines the maximum number of strikes that will be shown in the Option Chain for the selected expiration. The configured value determines the range of the displayed chain, including strikes closest to the underlying price.
The actual number of displayed strikes is still limited by the data-feed connection parameters (Overcharts main window > Connections Tab): if the data-feed allows subscription to fewer strikes, the chain will show at most the number allowed by the connection, even if the configured value is higher.
WARNING!
Increasing the number of strikes to display increases the number of subscribed instruments and real-time streams (Calls and Puts), directly impacting performance. For example, subscribing to 50 strikes actually subscribes to 100 distinct instruments (50 Calls and 50 Puts), corresponding to 100 separate real-time streams. It is recommended to use values consistent with your operational needs, PC performance, Internet connection, and the data-feed capabilities.
GEX Profile #
Volume to Use: Specifies which volume data to use in the GEX calculation: Open Interest only, Volume only, or Open Interest + Volume.
Positive GEX Color: Specifies the color of the bar when GEX is positive.
Negative GEX Color: Specifies the color of the bar when GEX is negative.
Opacity: Specifies the color opacity.
Bar Thickness: Specifies the thickness of the GEX bars.
Secondary Profile #
This is an additional profile designed to show GEX calculated on a different volume, or a profile that separately highlights Call GEX and Put GEX instead of Net GEX.
Draw: Specifies whether to draw the secondary profile.
Type: Specifies the type of profile to draw: Net GEX or Calls/Puts GEX.
Volume to Use: Specifies which volume data to use in the GEX calculation: Open Interest only, Volume only, or Open Interest + Volume.
Width (%): Percentage of space allocated to the Secondary Profile within the indicator area.
Call Color (Calls/Puts GEX only): Specifies the color of the ‘Call’ bar.
Put Color (Calls/Puts GEX only): Specifies the color of the ‘Put’ bar.
Opacity: Specifies the color opacity.
Bar Thickness: Specifies the thickness of the GEX bars.
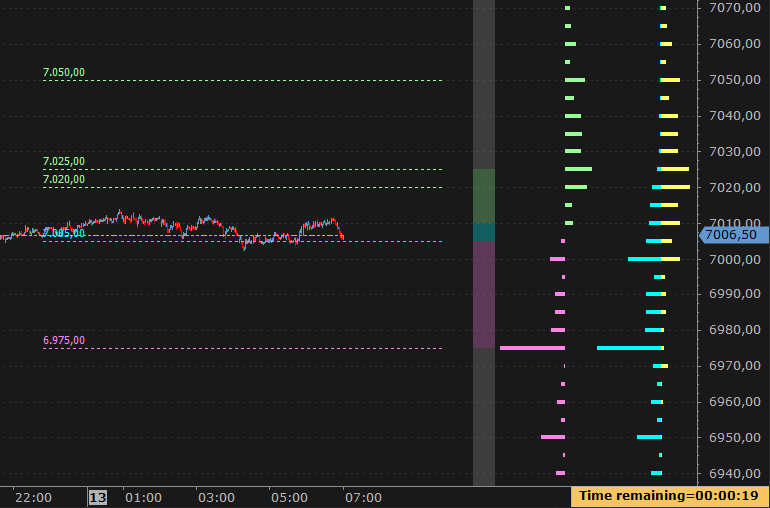
GEX zones #
GEX Zones are represented by a colored vertical bar on the chart, highlighting the distribution of Gamma exposure.
Each segment of the bar indicates a different GEX behavior:
- Positive Zone: positive GEX;
- Negative Zone: negative GEX;
- Transition Zone: transition from positive to negative GEX (or vice versa);
- Extreme Zones: strikes beyond the maximum positive GEX and, conversely, beyond the maximum negative GEX
This bar allows you to quickly identify price levels where the market tends to behave in a stabilizing, directional way, or near potential reversal points.
Draw: Specifies whether to draw the zones.
Width (%): Percentage of space allocated to the GEX Zones within the indicator area.
Support/Resistance Lines #
Support/Resistance Lines are horizontal lines drawn on the chart at significant Net GEX levels.
These levels represent strikes where net Gamma exposure is relevant and indicate points where the market tends to show price reactions.
In other words, the lines provide a visual reference to identify key operational zones derived directly from market makers’ hedging activity.
Draw: Specifies whether to draw the Support/Resistance lines.
Filter (%) [0–99]: This property allows filtering Net GEX levels based on a percentage threshold.
- Low values: minimal filtering, nearly all levels are displayed.
- High values, close to 99: only the most significant levels are displayed, removing less relevant ones.
In practice, the filter helps reduce noise and focus the analysis on the most important support/resistance levels.
Totals #
It is possible to display totals referring to all strikes involved:
- Total Net GEX: the sum of all Call GEX minus the sum of all Put GEX
- Total Call GEX: the sum of all Call GEX
- Total Put GEX: the sum of all Put GEX
Additionally, the Call/Put Ratio can also be displayed, which is the ratio between the total Call GEX and the total Put GEX.
FREQUENTLY ASKED QUESTIONS #
The downloaded CBOE CSV file produces no results #
In some cases, the CSV file downloaded from the CBOE website may contain Gamma values that are not yet populated. In this situation, the indicator may appear empty. Simply wait a few minutes and download the CSV file again.


