VOLUME PROFILE
The tick/volume analysis includes a package of indicators and tools that are essential to understand market movements in advance.
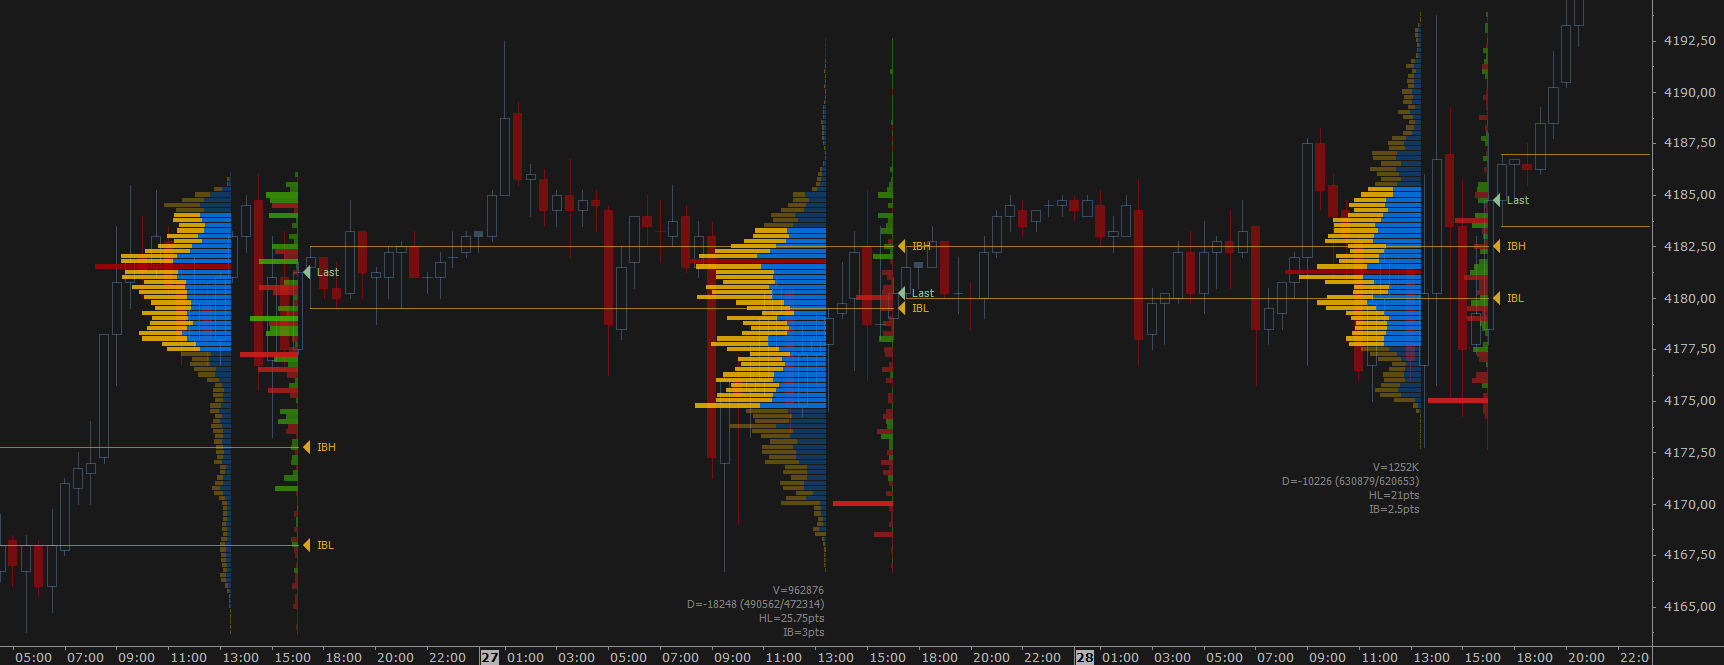
Volume Profile shows the volume traded in the various price levels, highlighting if there are more buyers or sellers.
Available: Volume Profile (intraday, session, composite, range, day, weekly, monthly, and additional column on DOM), TPO Profile, Volume Delta, VWAP, Volume Meter, Volume on Bid/Ask, Session Statistics and more.
Session Volume Profile
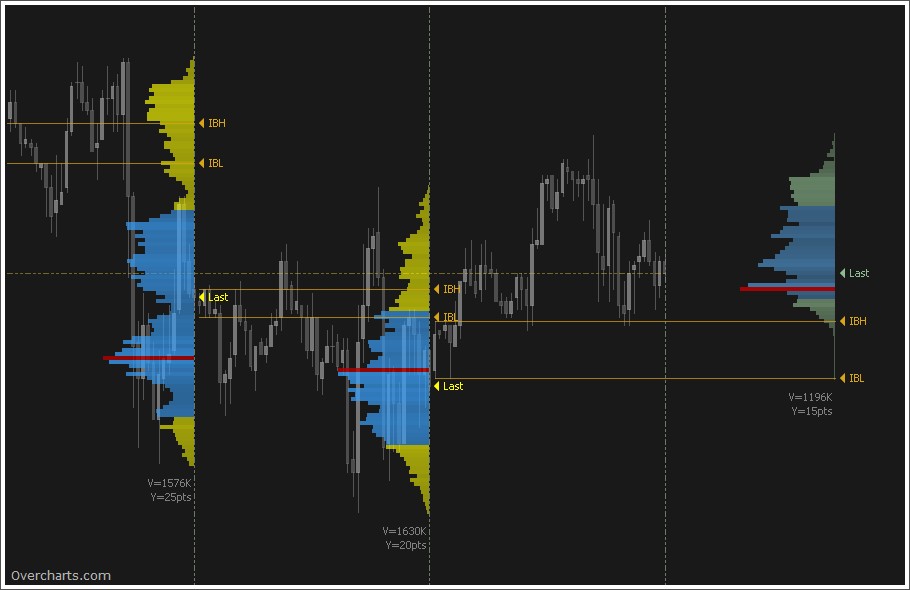
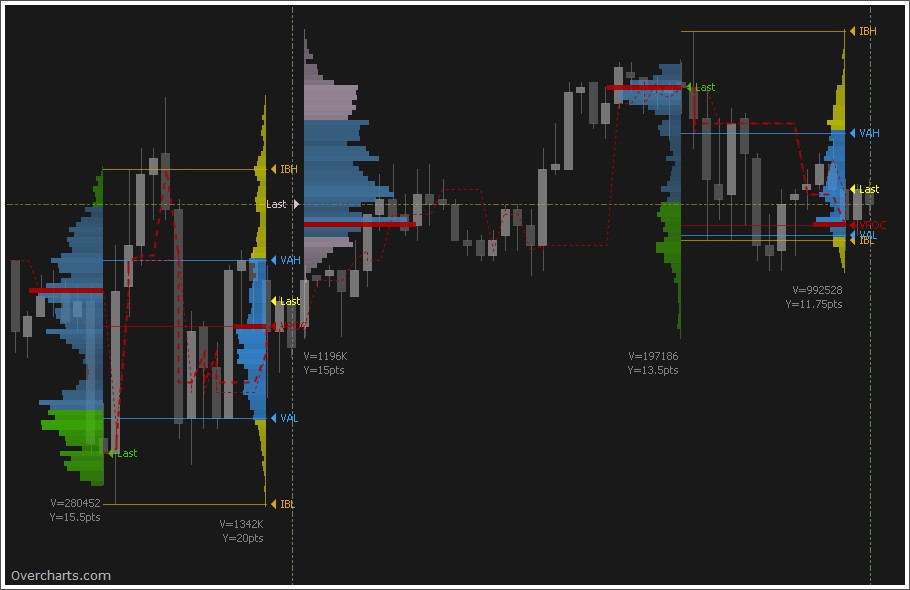
This Volume Profile is built on session (Trading Hours) defined in the reference chart or indicator settings. You can define four different sessions in the same indicator. The volume profile of each session is drawn at the beginning/end of session.
Intraday Volume Profile
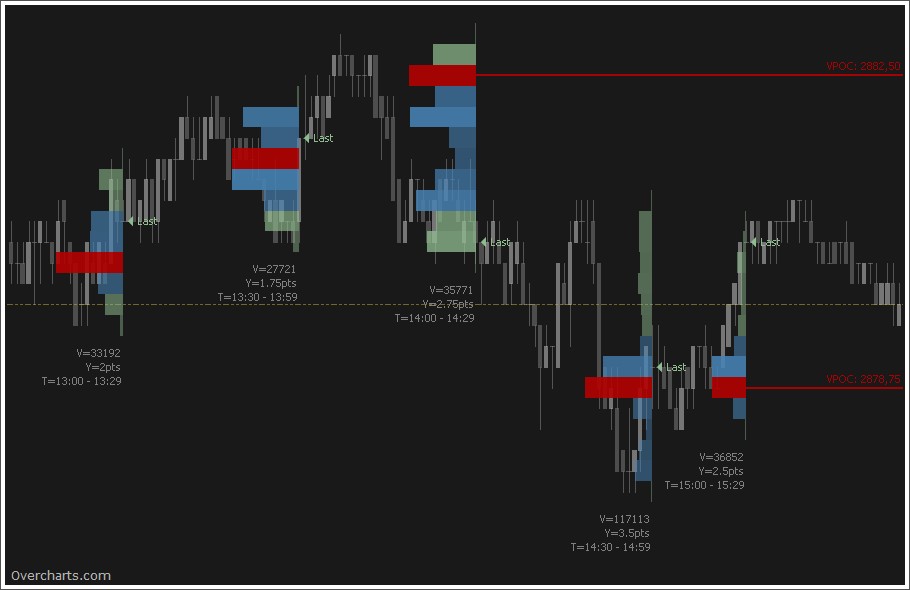
This volume profile is represented by a sequence of volume profiles built within the session at regular intervals. These intervals can be set in minutes or bars.
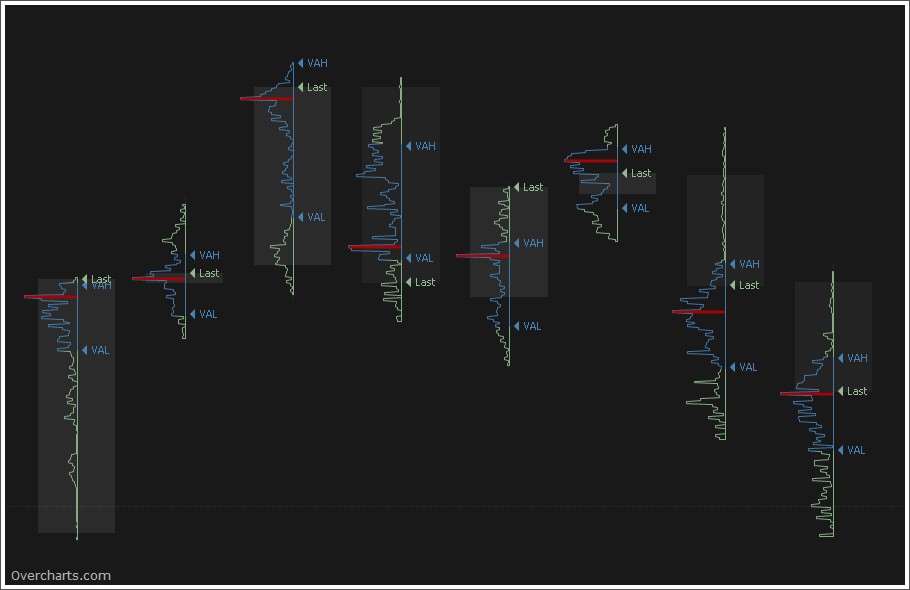
Long-Term Volume Profile
This volume profile is represented by a sequence of volume profiles built on last n sessions, n days, n weeks, n months, or n years.
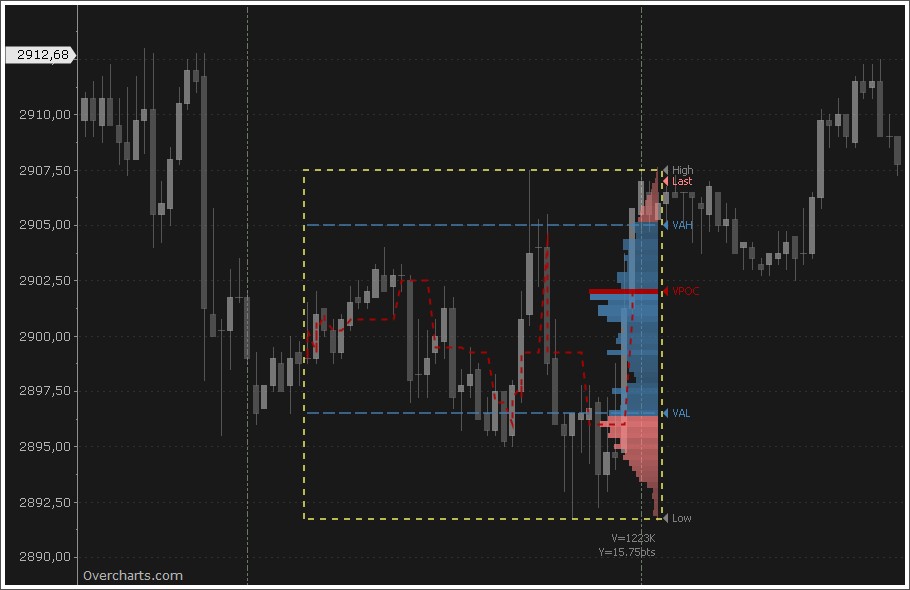
Range Volume Profile
This volume profile is built on a time range defined by the user. You can draw the range directly on the chart as a drawing tool.
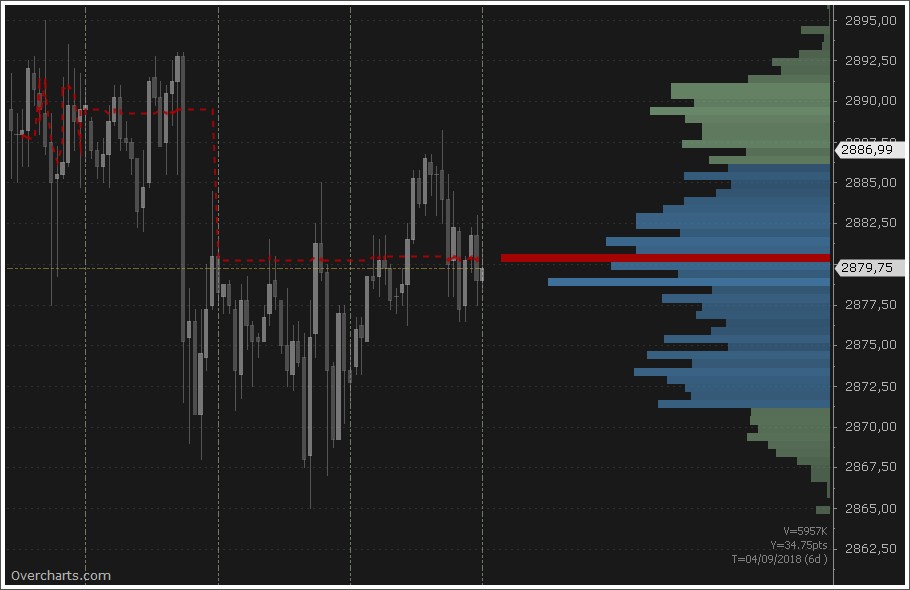
Composite Volume Profile
This volume profile is a summary volume profile built on last n sessions, n days, n weeks, n months, n years. Alternatively you can choose the starting date/time to build a volume profile from this date until the present time.
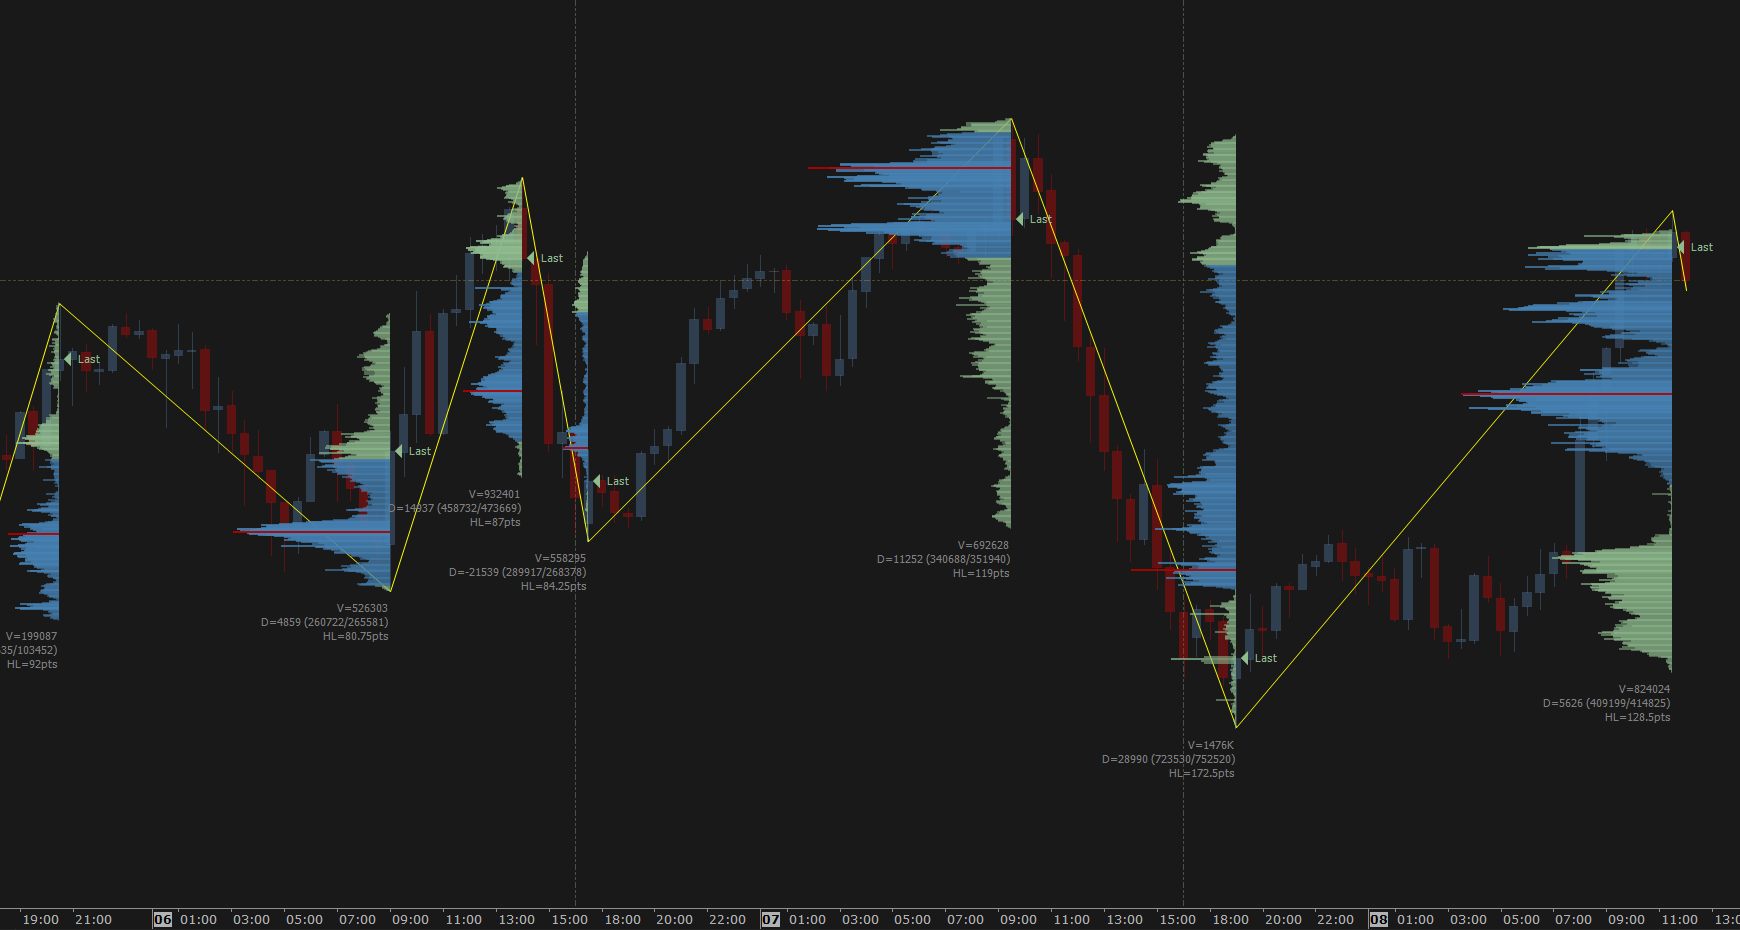
Swing Volume Profile
It allows constructing a volume profile for each leg of Zig-Zag. Zig-Zag is an indicator that identifies market swing points (turning points). A swing high is the highest point reached by an uptrend, while a swing low is the lowest point reached by a downtrend. The only setting required for calculating Zig-Zag is minimum trend length (in price).
| Main Features | Session | Intraday | Long-Term | Range | Swing | Composite | ||
|---|---|---|---|---|---|---|---|---|
VPOC |
||||||||
VPOC Trace Line |
||||||||
Naked VPOCs |
||||||||
Value Area |
||||||||
Open Gap/Lap |
||||||||
Markers and Lines |
||||||||
Summary Info |
||||||||
Peaks and Valleys |
||||||||
Face left or right |
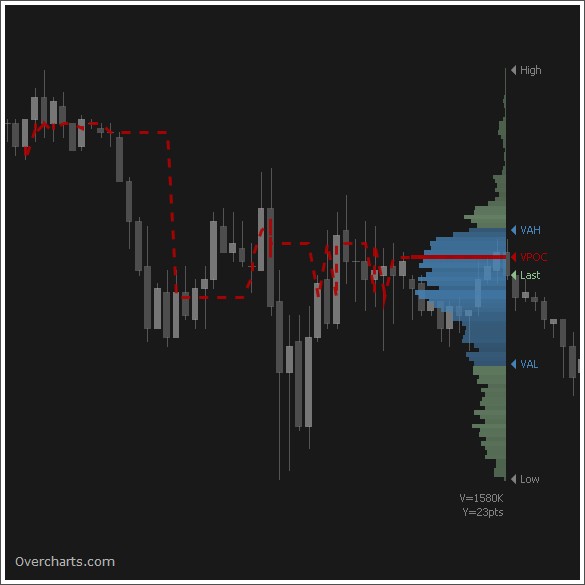
VPOC & Trace line
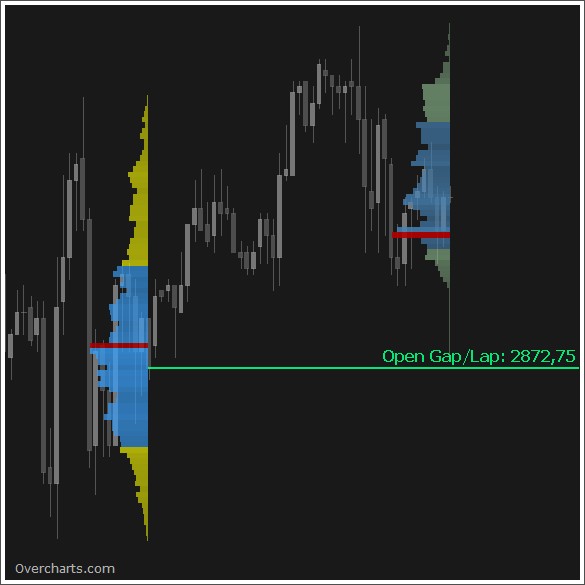
Open Gap/Lap
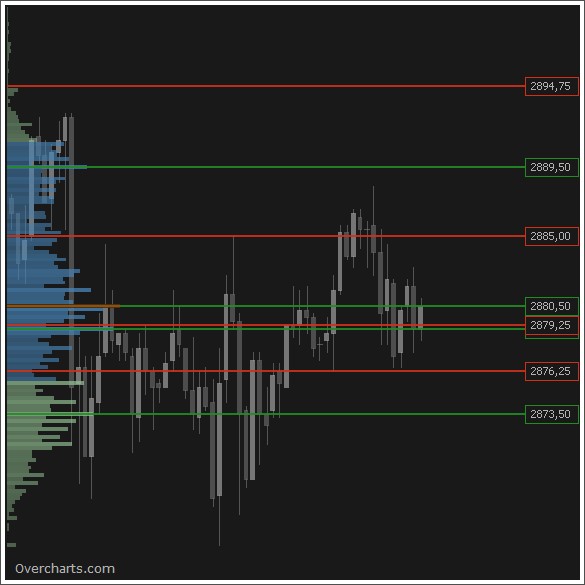
Peaks & Valleys
Bid/Ask style & Delta Profile
You can display Volume Profile in Bid/Ask style and/or draw Delta Profile side by side (right or left) or overlapped on Volume Profile.
