


Download Overcharts and join us! Start trading now with your favorite broker.
FREE 30-DAY TRIAL
Analyze and Trade the markets using Professional Tools
The initial configuration takes only a few minutes
Download & Install Overcharts
Create a new account
Configure the connection/s to your brokers (*)
Choose your favorite Instruments
Open a new Workspace
* Just user name and password

3 - TRADE
Trade only with trusted brokers on the best international exchanges.
DOM and Chart trading of stocks, futures, commodities, options, spreads and forex.
Simultaneous Connections to Multiple Brokers & Data-Feeds
No limit to the number of simultaneous connections.
With Overcharts, you can connect to all supported brokers and data feeds at the same time.
For each instrument, you can choose a different data feed for historical and real-time data and set up the broker you prefer.


Trading SIMULATOR
Train your trading skills with zero risk!
With the built-in Overcharts simulator, you can practice and test your strategies in complete safety.
All trading within the simulator is fully simulated and runs locally: no orders are sent to your broker.
Market REPLAY
Rewind the market and relive every moment.
With Overcharts’ Market Replay, you can review historical data as if it were live, analyze every detail, and test your strategies in a safe, controlled environment.
Trade COPIER
One trader, multiple accounts.
Overcharts’ Trade Copier lets you automatically replicate the trades of a Leader account across multiple Follower accounts, saving time and maximizing precision and efficiency.
GEX Profile – Gamma Exposure
Native GEX Profile.
Overcharts is the first professional platform with an integrated GEX Profile, at no extra cost!
The GEX Profile (Gamma Exposure) is an indicator designed to identify price levels that act as support and resistance, derived directly from the options structure.
Unlike classic technical levels, these levels are not the result of formulas based on past prices, but arise from where options gamma concentrates forces that stabilize or accelerate the market. [more info]
Volume & Orderflow Analysis
Volume analysis includes a complete set of essential indicators and tools to anticipate market movements. Available: Volume Profile, Delta Profile, TPO Profile, Volume Ladder (footprint), Market Depth Map, Volume Bubbles, Volume Delta, VWAP, and many more…
Volume Profile
The Volume Profile shows the distribution of traded volumes at each price level, helping to understand where the market has actually operated. It allows you to identify support and resistance zones, key price levels, and equilibrium areas where the market tends to consolidate.
This visualization makes it easy to see where the largest trades are concentrated, anticipate trend reversals or continuations, and optimize entry and exit points. It is an essential tool for anyone who wants to analyze market structure clearly and efficiently. [more info]
TPO Profile
TPO Profile (a.k.a market profile®), is similar to volume profile. Time-Price-Opportunity (TPO) shows the price distribution during the specified time and highlights at which levels the price has spent the most time. [more info]
TPO profile is generally used in conjunction with volume profile to better identify areas of support and resistance.
Volume Ladder
The Volume Ladder (aka footprint) is one of the most important indicators of order flow analysis. It displays Volume, Bid/Ask, Delta and other volume statistics together inside each bar. [more info]
Unlike traditional bar or candlestick charts, the volume ladder combines Price, Volume and Order Flow all in one. Acceleration, deceleration, absorption, bid/ask volume levels, delta and lots of other information into a single intuitive chart.
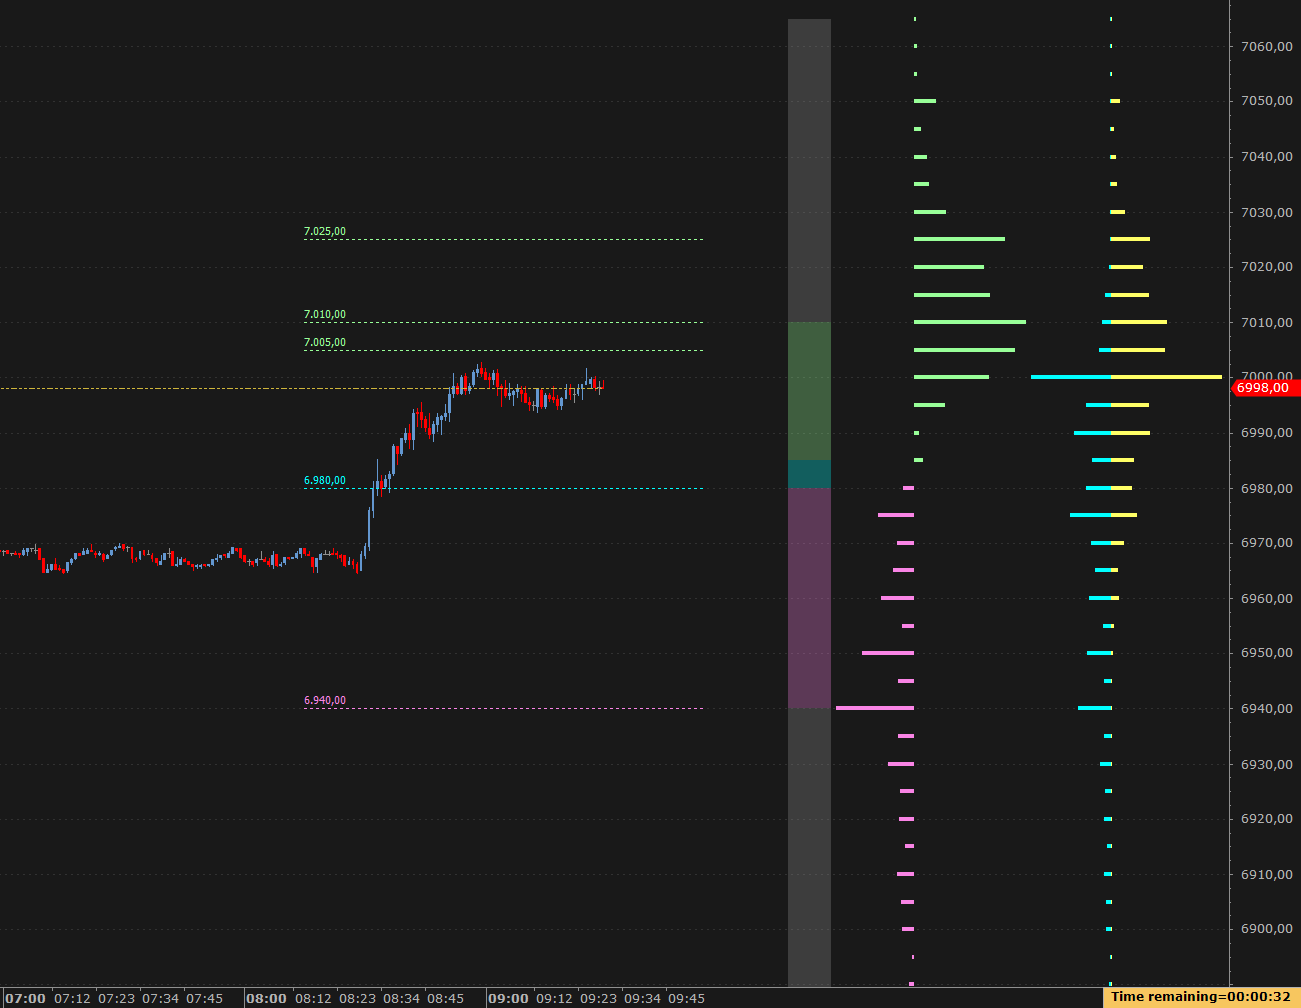
Market Depth Map
More and more traders are using Market Depth while conducting volume analysis. Its main function is to help traders identify potential levels of support and resistance.
This indicator uses data from the limit order book (DOM) and works in real-time and with historical data, if it was previously saved in the local database. When you open the indicator, it shows historical data right away if available. If not, it starts collecting real-time data and builds the history over time. Price levels are shown with different colors based on the volume at each level — the higher the volume, the stronger the color. This color display, called a heatmap, helps you easily spot possible support and resistance levels. [more info]
Workspaces & Chart Analysis
Multiple Workspaces
Organize your trading and chart analysis into multiple workspaces. Overcharts uses intensive multi-threading for chart calculation and refresh. This means that each workspace is updated independently and at the same time.
Each workspace can be placed in a different monitor and contain different DOMs, Watchlists, Time & Sales, Charts, etc. [more info]
Chart analysis
With a 4k Ultra-HD graphics engine, Overcharts offers the ability to make the clearest and most immersive trading experience ever. Analyze the market with many different types of charts, such as Candlestick, Bar, Line Equivolume, Candlevolume, Point & Figure, Kagi, Renko, Three Line Break, Heikin Ashi, Dot on Close, Volume Bar, Range Bar, Reversal Bar and Trend Hollow Candlestick. Overcharts also has all common indicators available that can be plotted on the charts, along with the ability to plot charts of other instruments on top of existing data with any resolution. [more info]
Each chart (or data series) can display up to 100 million bars on a 64-bit operating system.
Advanced Drawing tools are available: Trendline, Fibonacci, Elliott, Pitchfork, numerous Channel types, Measurement tools and many others.
Build your own Indicators and Trading Strategies

1 - BUILD
Create your trading strategies and indicators using OverBasic, a basic style easy language.

2 - BACKTEST
Optimize your strategies by performing accurate backtesting and consulting the results in detailed reports.