CHART ANALYSIS

With a 4k Ultra-HD graphics engine, Overcharts allows you to make an advanced technical analysis using many types of charts. In the same window you can insert indicators and charts of the same instrument (or different instruments) with any resolution. Each chart (or data series) can display up to 100 million bars on a 64-bit operating system. Advanced Drawing tools are available: Trendline, Fibonacci, Elliott, Pitchfork, numerous Channel types, Measurement tools and many others.
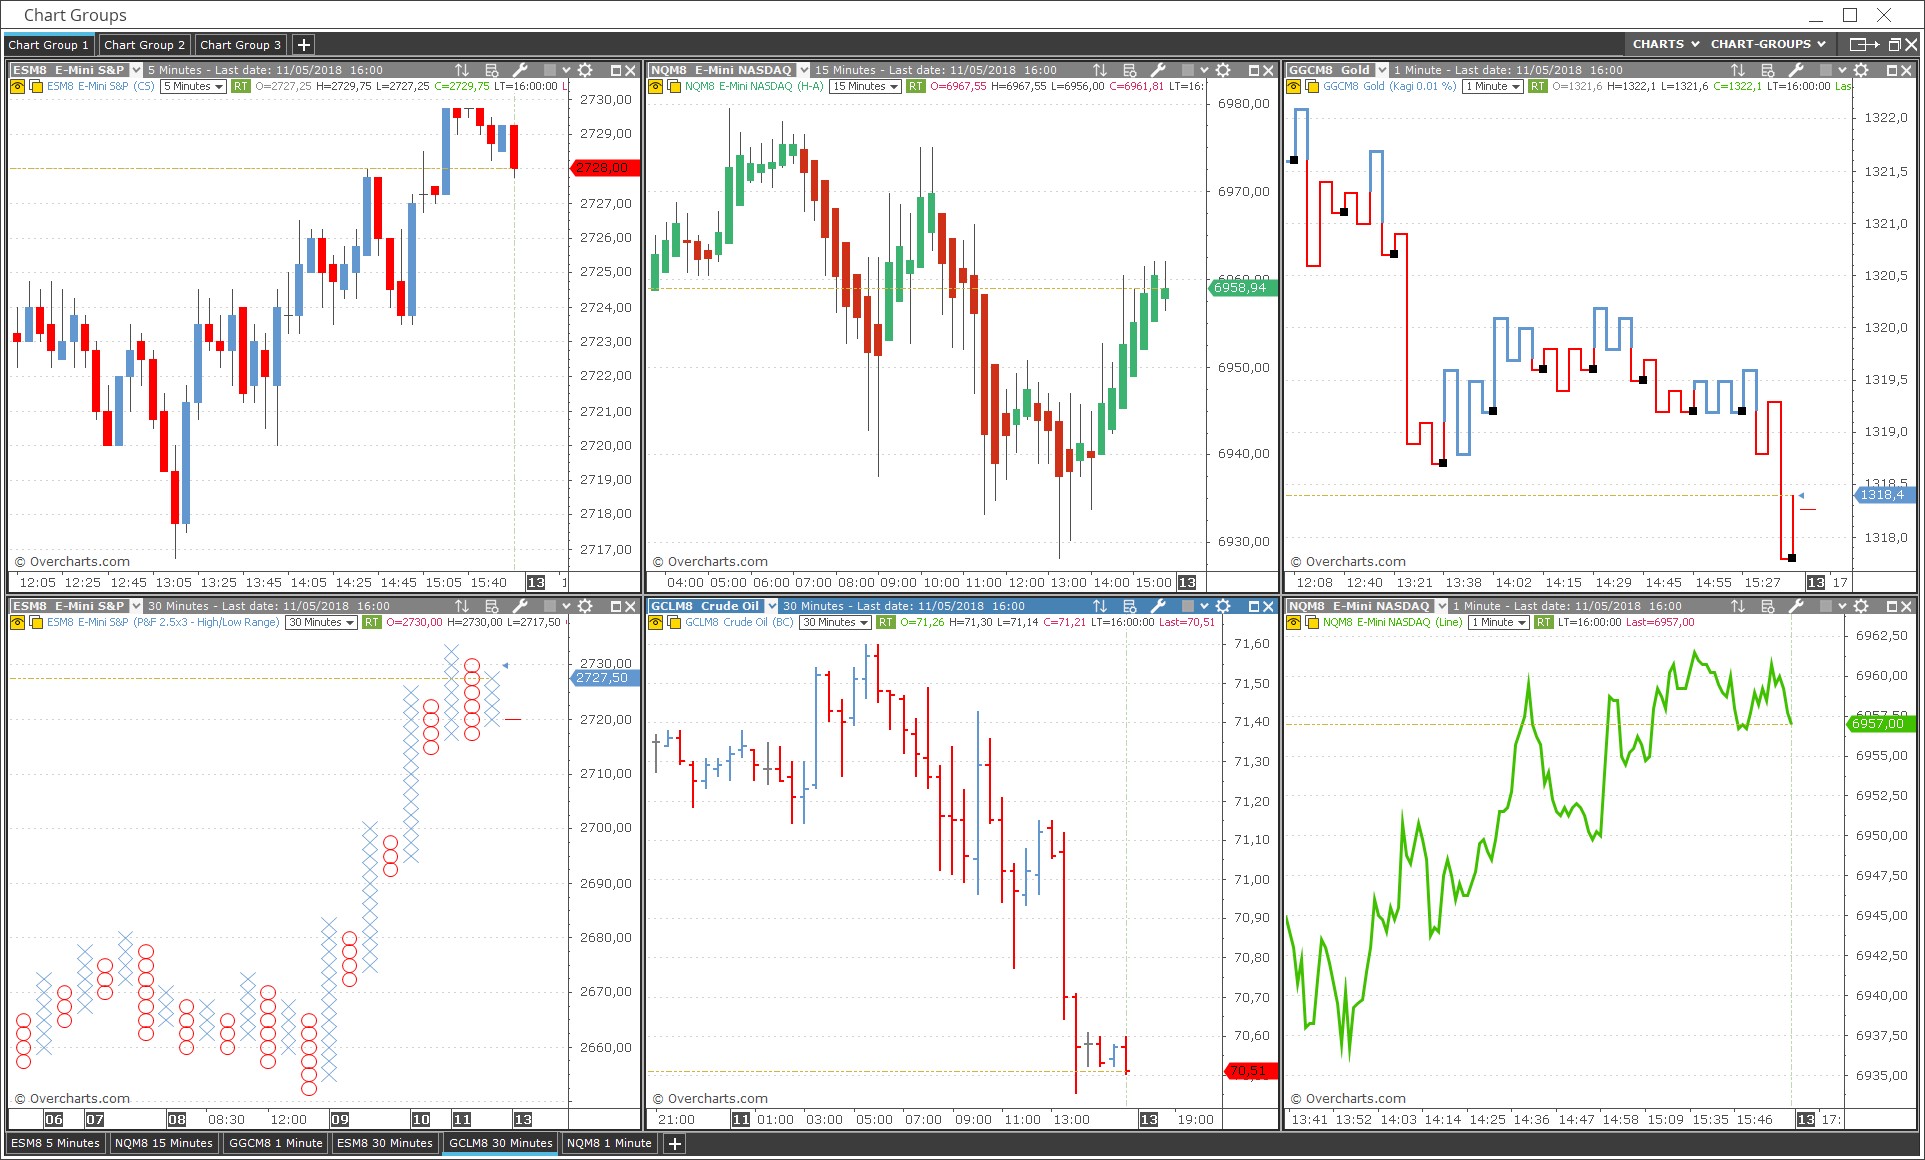
Chart-Group

A chart-group is chart container. A workspace can contain up to 1000 charts split up into different chart-groups. Each chart-group can contain up to 200 charts. To optimize calculation and drawing performance we recommend you splitting the charts into different workspaces. If you are working with multiple monitors we suggest you to use one workspace per monitor.

Each chart can contain millions of bars while keeping the real time performance unchanged

For each chart you can choose the session, time zone, and holidays list

Hundreds of properties to customize charts, indicators, drawing tools
Stand-by chart windows

You can park a chart window instead of permanently deleting it. When you close a chart window, you can decide whether to delete it permanently from the workspace or put it on stand-by mode for future reuse. The stand-by chart windows retain all settings.

Multiple data feeds

Every instrument can have a broker, a historical data feed and a real time data feed different from each other.

Templates

Save the settings of a chart window as a template to apply it to other chart windows. It is an easy way to open several chart windows with the same settings.

Background dragging

The background of a chart window can be moved by dragging it. This mode can be activated/deactivated by a specific button or menu. When dragging is disabled, a mouse click on the background displays the current values of the objects.

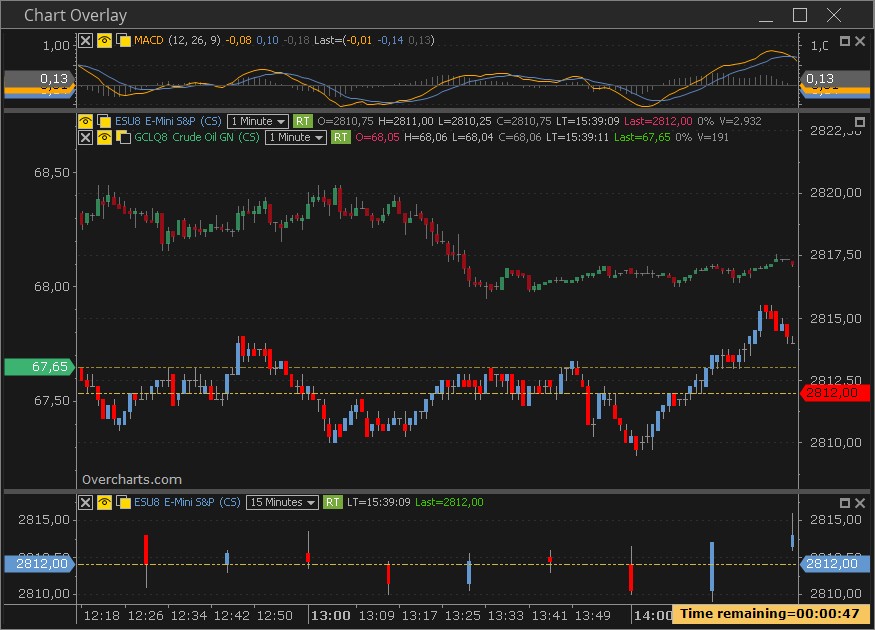
Overlay

Overcharts allows you to overlay charts and indicators with different price scales and independent from each other in the same window.
null

Resolutions

Overcharts allows you to add charts with different resolutions in the same chart window.

Price scales

You may choose between linear or semi-log axes. You may display two separate vertical scales (left/right). This means that, for example, you can have the scale of an indicator on the left and the scale of the instrument on the right or vice versa.
null

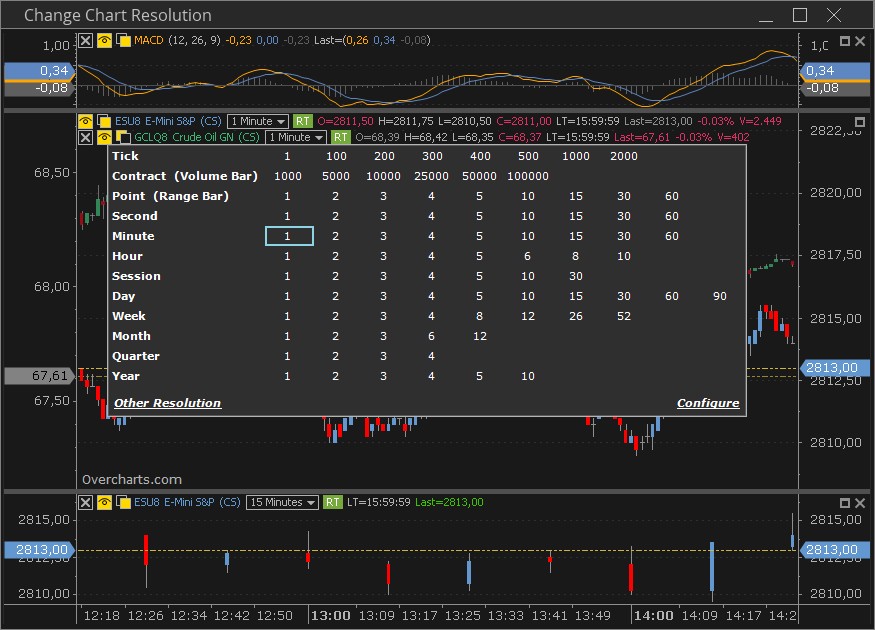
Change Chart Resolution

Change chart resolution with one click using the status line. You can configure the values of the “quick resolution” window as you wish.