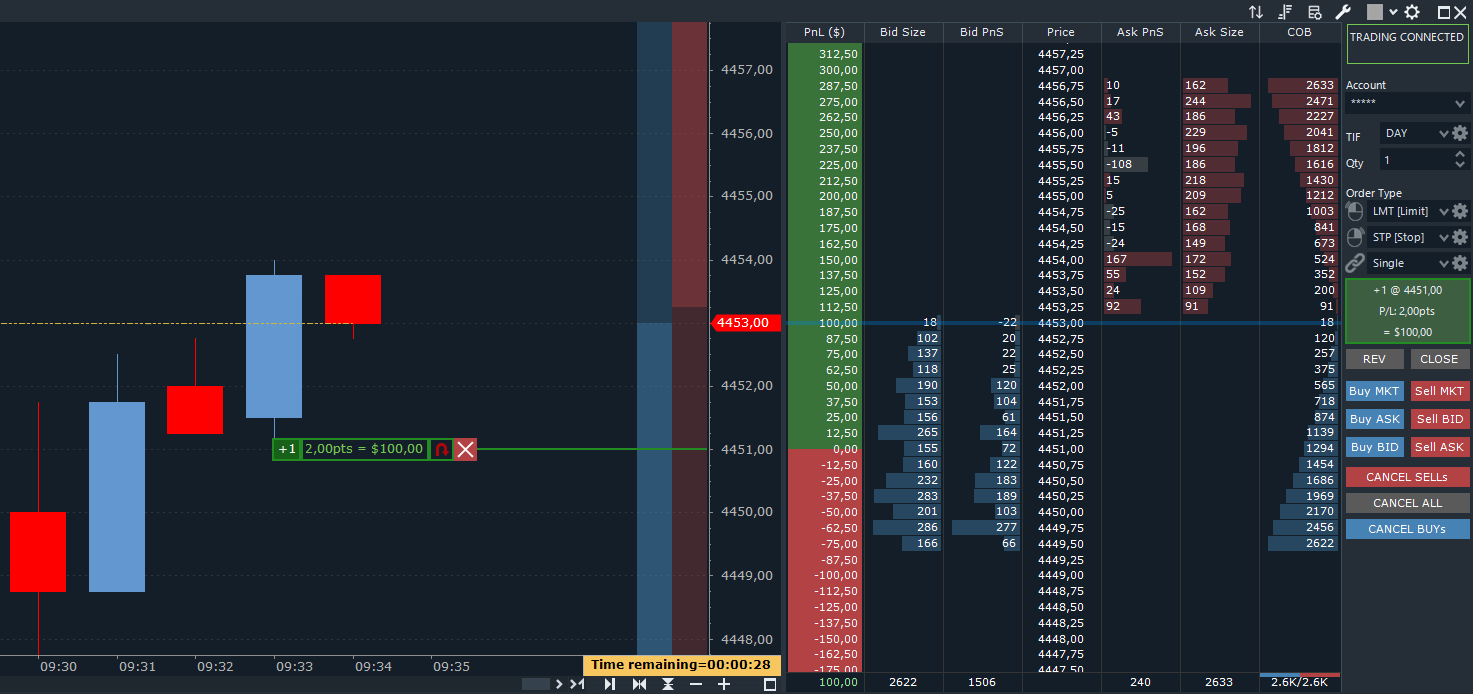
Chart Advanced Columns
Advanced Columns are vertical column indicators synchronized with the window main chart.
Many Advanced Columns are available: DOM Bid/Ask, Cumulative Order Book (COB), Pulling/Stacking, Profit/Loss etc.
Whether you trade from chart or DOM, you will no longer be able to trade without Advanced Columns!
New columns are added with new releases.

Chart Advanced Columns
- Advanced Columns are vertical column indicators synchronized with the window main chart and located to the right of chart.
- You can add as many columns as you like to the chart and place them according to your needs. You can also add the same column multiple times.
- Whether you trade from chart or DOM, you will no longer be able to trade without Advanced Columns!
Some important Advanced Columns available:
DOM Bid/Ask
The classic DOM columns: Price, Bid, Ask.
Using DOM columns on chart, you will have a DOM synchronized with the window main chart on the same window as the chart.
Cumulative Order Book (COB)
Cumulative-Order-Book shows the cumulative sum of order book sizes and helps you understand the strength of buyers and sellers.
Pulling/Stacking
These columns show the variation of current order book Bid/Ask sizes compared to an earlier snapshot.
Positive values at certain price levels indicate an increase in interest in that price zone. Conversely, negative values indicate a lack of interest.
If price is moving in a direction and liquidity is pulled in front of price (and stacked behind), this may indicate a continuation of the very short-term trend.
Conversely, if price is moving in a direction and liquidity is stacked in front of price (and pulled behind), this may indicate the end of the very short-term trend.
Current Traded Volume
These columns show the accumulated volume from a specific point in time at various price levels. In other words, it is a partial Volume Profile. The data used are only REAL TIME data. No historical data is considered.
Recent Volume
These columns show the accumulated volume at various price levels as long as the price remains unchanged. When the price changes and subsequently returns to the previous level, the volume is reset and a new accumulation begins at that price level. The data used are only REAL TIME data. No historical data is considered.
Profit/Loss
Displays the open position profit/loss. It is drawn only if chart-trading is enabled.
Volume/Delta Profile
Displays a Volume/Delta Profile built over the last x sessions, days, weeks, months, years, or from a specific date/time up to the last available bar on the chart.
Power Meter
Measures buy/sell pressure by summing quantities traded over the last x seconds, providing a dynamic and immediate view of market strength in the form of histograms.

